
.png)
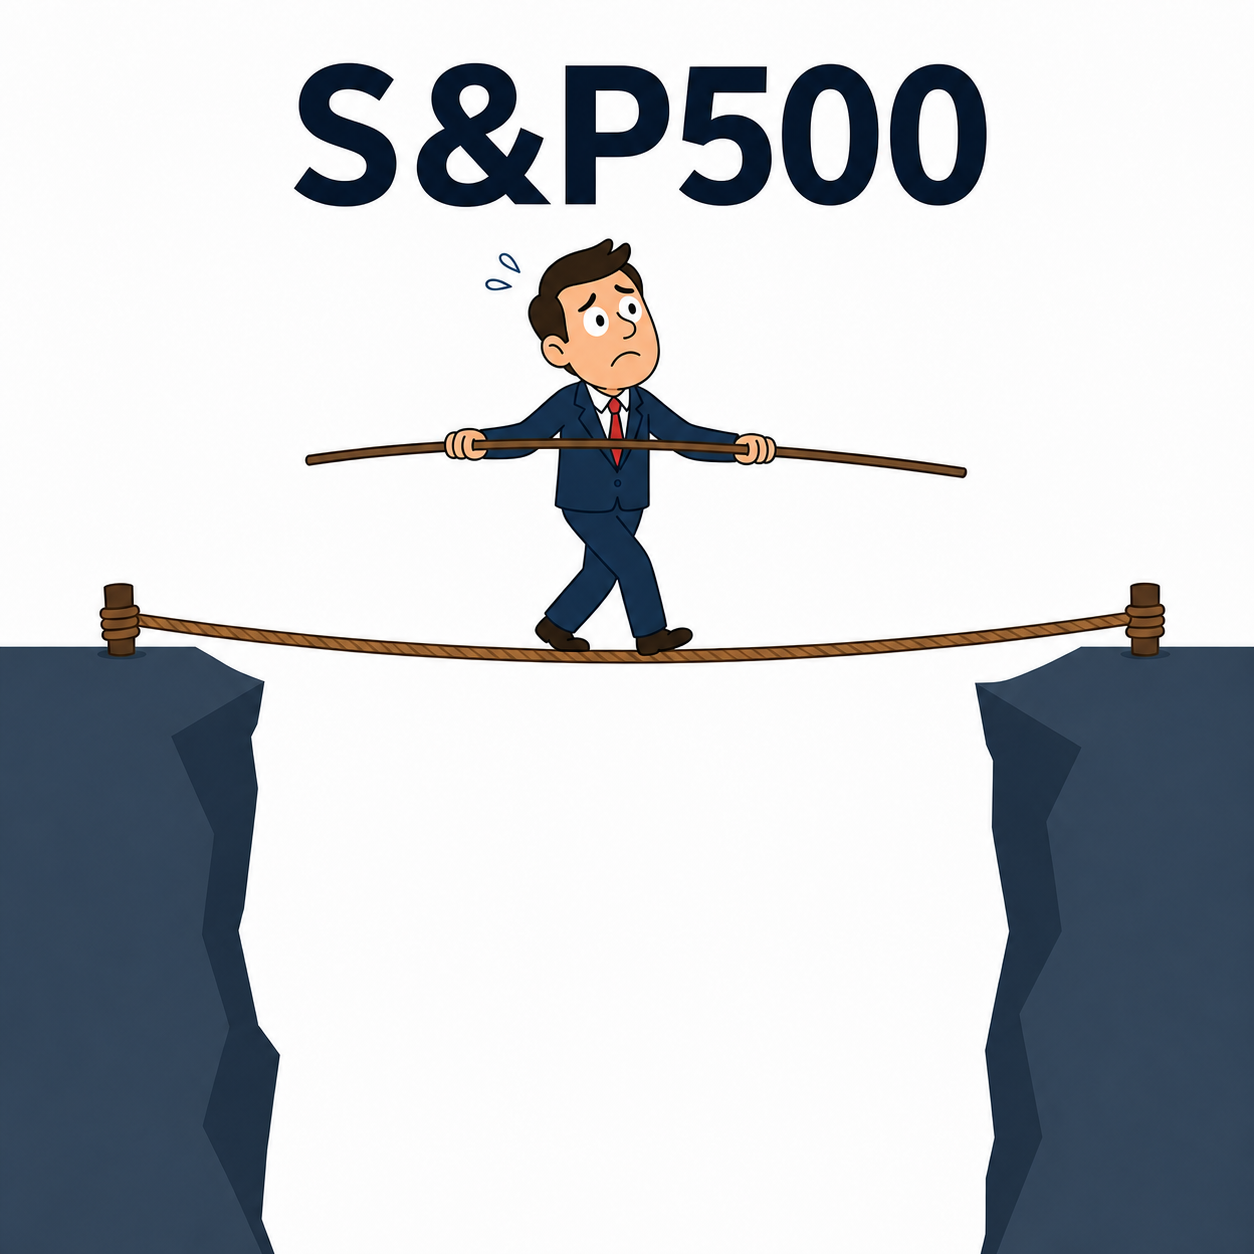
Stocks are betting on normalization. Bonds are betting on persistent inflation and higher rates. One of these markets may be looking further ahead.
KEY TAKEAWAYS
-
The S&P 500 is at a record high even as a major geopolitical disruption remains unresolved. Crude tanker traffic through the Strait of Hormuz has remained near zero for months, creating an extraordinary disconnect between market sentiment and physical energy flows.
-
Oil prices have not fully reflected the severity of the disruption because inventories are absorbing the shock. That can postpone the price signal, but stockpiles are finite and cannot permanently replace normal supply flows.
-
American consumers have already experienced the consequences through gasoline prices. Prices have retreated from their spring peak, but they remain substantially above pre-conflict levels and continue feeding into household budgets.
-
Inflation has moved materially away from the Fed’s target after nearly getting there earlier this year. Energy costs and tariff-related pass-through have helped push CPI back higher, complicating the case for monetary easing.
-
The Treasury market looks considerably less relaxed than the equity market. Rising 2-year and 10-year yields suggest investors are preparing for persistent inflation and interest rates that remain higher for longer.
MY HOT TAKES
-
The stock rally is legitimate, but markets may be assuming an unusually cooperative resolution to several unresolved problems. Strong earnings and mega-cap fundamentals provide real support, yet that does not make the geopolitical and inflation risks disappear.
-
The surprisingly moderate price of crude may be giving investors false comfort. Inventory depletion is cushioning the immediate shock, effectively delaying rather than necessarily eliminating the economic consequences of disrupted supply.
-
Gasoline prices may be a more useful real-time economic signal than many investors appreciate. Consumers experience energy inflation immediately, long before those effects are completely visible in official macroeconomic statistics.
-
The disagreement between stocks and bonds deserves attention. Equities appear willing to extrapolate favorable outcomes, while fixed-income markets are demanding compensation for inflation, fiscal uncertainty, and persistent rates.
-
When markets disagree over a slow-moving inflationary risk, I put more weight on the bond market. Momentum can keep stocks climbing for a long time, but Treasury investors have considerably less incentive to ignore what persistent inflation could mean for rates.
-
You can quote me: “Bonds are the guy at the poker table trying to count the cards while everyone else is just enjoying the free drinks.”
Don’t look down. If you are one of those folks that gets everything they need to know about the global economy and financial markets from that free app on your smart phone, I am envious of you. You might have been walking your dog while trying to keep a bunch of shopping bags from slipping off your shoulder. It is hot–it’s summer! You are holding that bag you used to clean up after your dog–holding it far away. You swipe the unlock slider on your phone and you see the S&P 500 up by 0.65% at 7798.99–it’s an all-time high–AWESOME. You swap apps on your phone to your favorite shopping app and you look over that shopping cart you have been curating. Your thumb doesn’t hesitate–everything is good in the world with the S&P 500 at an all-time peak–you press BUY NOW. DoorDash is next up. Why not top off the amazing day with an overpriced meal delivery.
That number blinking on your screen 7,798.99, a fresh closing record is real. It’s not a mirage. The S&P 500 has been on an absolute tear, and if that’s the only chart you check before tapping BUY NOW, you’d have every reason to feel like a genius. Fresh highs. BIG green up-arrows. Check out the S&P 500 chart going back 10-years. Vibes immaculate.
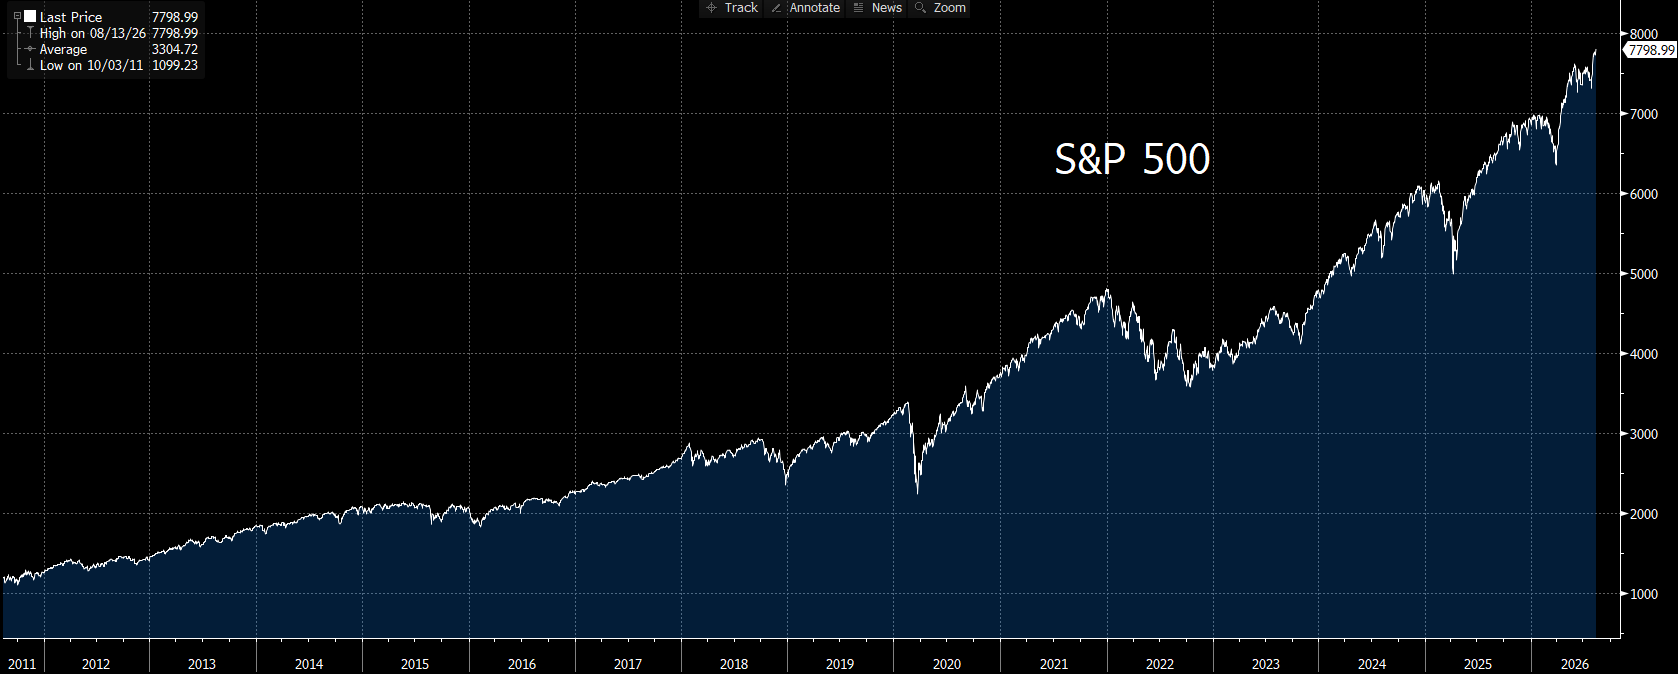
Now, I want you to do something your phone doesn’t encourage. I want you to look down. Not at the sidewalk, not at the smelly bag you’re holding at arm’s length–down, at the plumbing underneath that index. Because there’s a chart that’s been sitting flat on the floor for months, and it tells a very different story than the one your app is selling you. It’s a chart that I have been pushing all over the place for weeks, but shockingly it has not gotten much interest. Have a look.
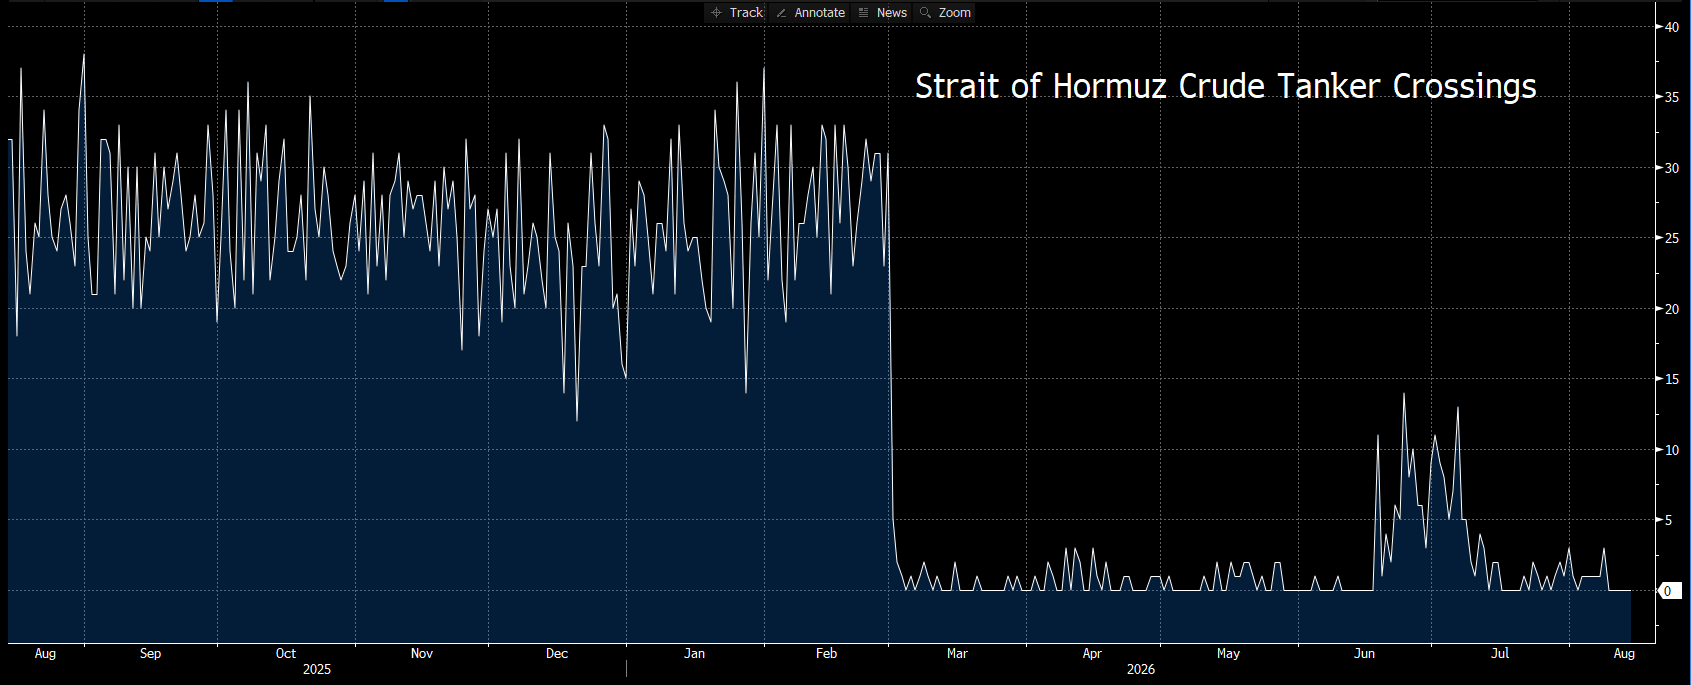
This is a chart of crude tanker traffic through the Strait of Hormuz. We all know by now that this is one of the most important chokepoints on Earth, the corridor roughly a fifth of the world’s oil and liquefied natural gas has to squeeze through to get from the Gulf to everywhere else. Crossings collapsed when the shooting started at the end of February, and they have not meaningfully come back. You can see that small bump in June–the market’s brief moment of hope, when a ceasefire MOU was in force, and then it rolled right back over. As of this week, traffic is functionally at…um, zero. The Strait isn’t “reopening soon.” It’s been closed for the better part of six months, and Wall Street’s most-watched index just doesn’t seem to care.
That’s the trick with “don’t look down.” You can walk the wire just fine as long as you never glance at what’s underneath you. The S&P is currently walking a wire strung directly over a shut oil chokepoint, and it hasn’t looked down once.
Now here’s where it gets genuinely strange, and where the shopping-app crowd gets fooled twice. You’d think a closed Strait means expensive oil. That’s Econ 101! Restrict supply and price goes up. Check out this chart and keep reading.
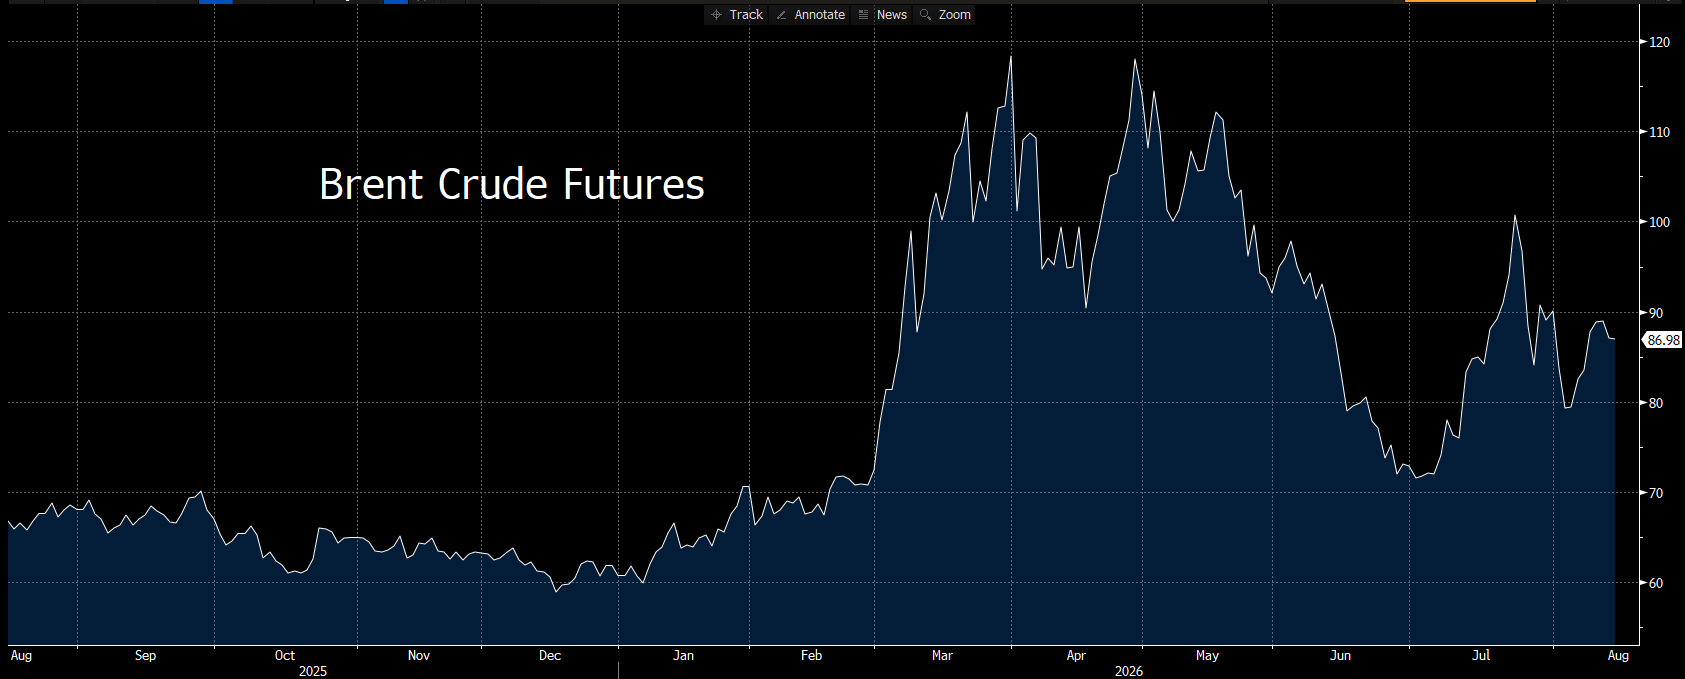
This is a chart of Brent Crude futures. You would think crude would be through the roof based on the Hormuz traffic chart from above. 🙃 Except it hasn’t, not really. Brent crude is sitting in the high $80s, well off the spring spikes above $110 and, frankly, unremarkable by the standard of the last two years. The world hasn’t been starved of oil…yet. Because everyone has been quietly burning through stockpiles instead! The International Energy Agency (IEA) has said as much, in polite bureaucratic language: global reserves are draining, and reopening the Strait is becoming “more pressing” by the week. Translation for the Millers, sitting at their kitchen table in Ohio: you’re not paying up at the pump because the world has plenty of oil. You’re not paying up yet because the world has been living off its savings account instead of its paycheck. Savings accounts run out. And even without a full-blown Hormuz price shock at the pump, the Millers have already felt this one in their own driveway. Have a look at this chart, and keep reading–be patient–almost there.
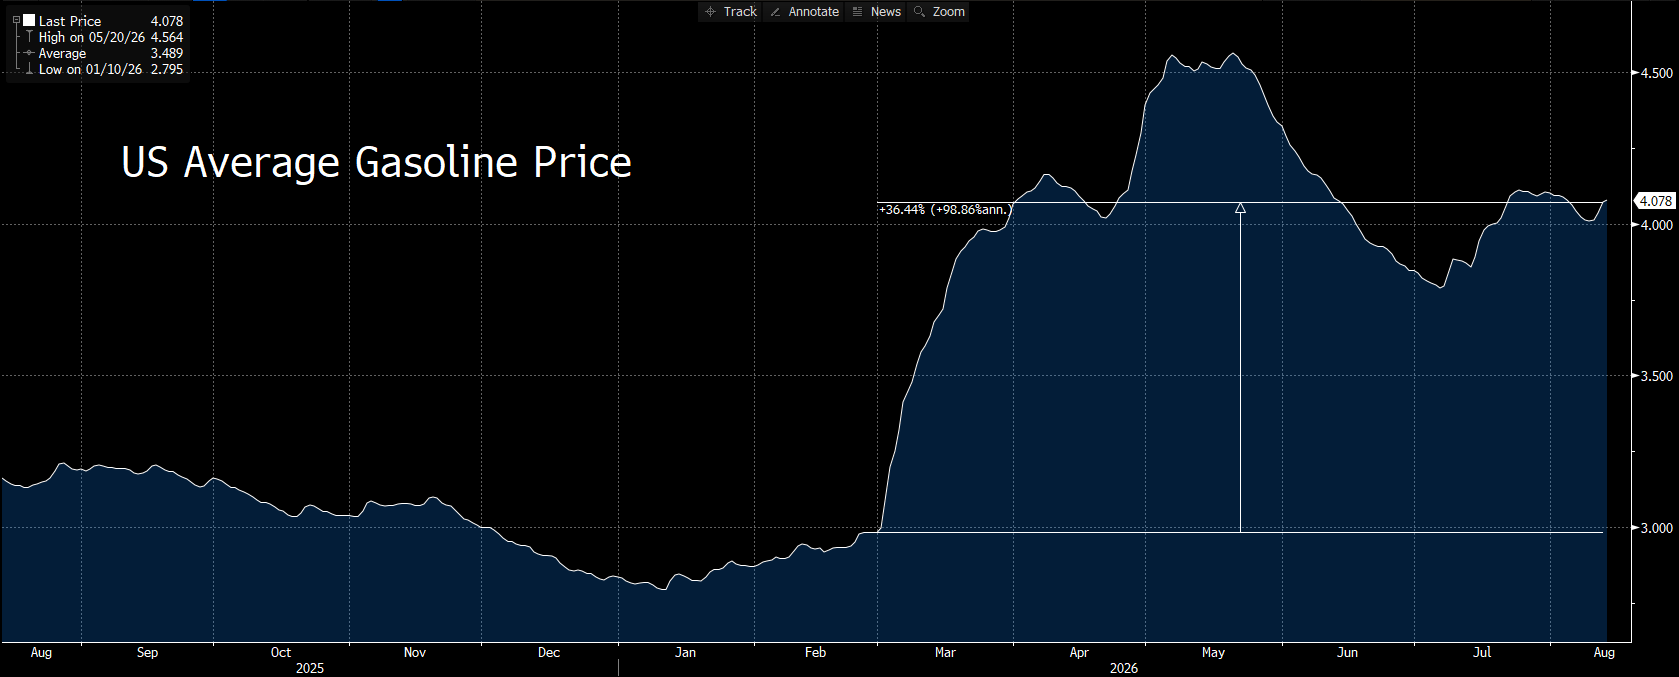
This is a chart of the average US gas price per gallon. Twelve months ago you were filling up for well under $3.70 a gallon. By this spring, with the Strait closed and the war escalating, the national average had surged more than 53% off its pre-conflict price to as high as $4.56 (it was even less than $3.00 in early winter). This is the kind of move that shows up in a family’s grocery budget long before it ever shows up in a Fed press conference. It’s cooled since, back to a bit over $4.00 as of this week. But “cooled off” and “back to normal” are two different sentences. The Millers are still paying meaningfully more to fill up than they were paying last summer, and the reason sitting underneath that price is the same chart nobody’s looking at–the empty highway through the Gulf. And this is where the gas pump and the grocery aisle start talking to each other.
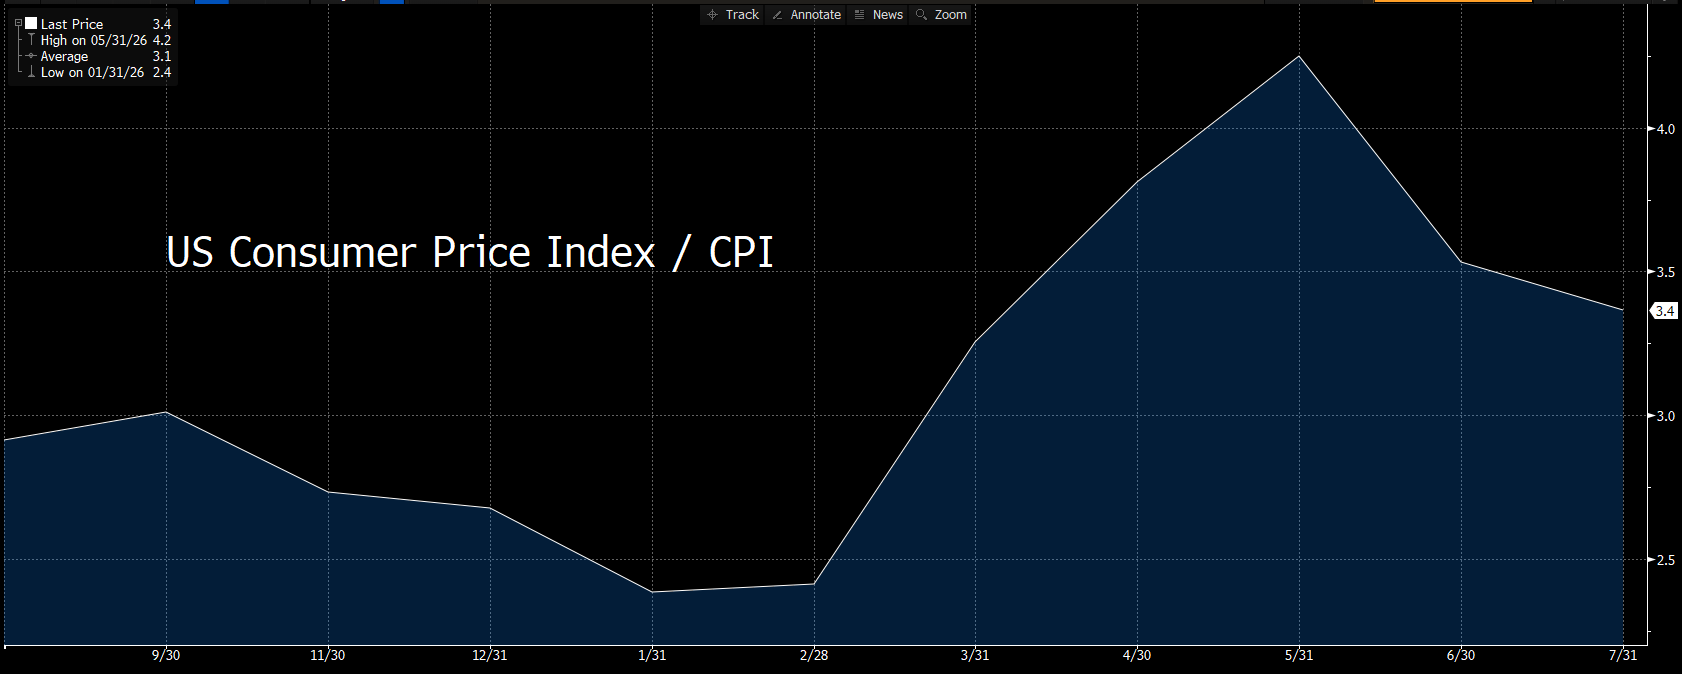
US Consumer Price Index, year-over-year. Bottomed near the Fed’s target in January, spiked through the spring, still running hot at 3.4%.
This is a chart of the Consumer Price Index / CPI reflecting the 3.4% July print we got earlier this week. Please note how headline inflation bottomed out around 2.4% back in January, genuinely close to the Fed’s target, the kind of number that gets central bankers doing a quiet victory lap. Then it turned. By May it had nearly doubled, to 4.2%, largely on the back of energy costs and tariff-driven pass-through working their way into everything else Americans buy. It’s eased since–but eased doesn’t mean solved. We’re still running a third hotter than where the Fed wants to be, and a good chunk of that stickiness traces back to the same chokepoint story: energy costs bleeding into everything that moves by truck, ship, or delivery van.
So to recap what your phone won’t show you in one swipe: the Strait’s been shut for six months with no real sign of reopening. Oil is masking that with a stockpile drawdown that has a shelf life. Gasoline already spiked hard once this year and hasn’t fully round-tripped back down. And inflation, after a genuine head-fake toward target, is running hot again on exactly the inputs this crisis touches. That’s four charts of real-world friction sitting directly underneath an index that just posted an all-time high.
Stocks, for now, have decided to look past this. All good—we know that stocks do this sort of thing. Stocks are momentum machines with the emotional range of my Cavapoo, Eloise, spotting a squirrel through the window: genuinely, joyfully present-focused, zero interest in tomorrow until tomorrow shows up uninvited and she has to bark at it.
Bonds are not Eloise. Bonds are the guy at the poker table trying to count the cards while everyone else is just enjoying the free drinks. Ok, check out my LAST chart and follow me to the finish!
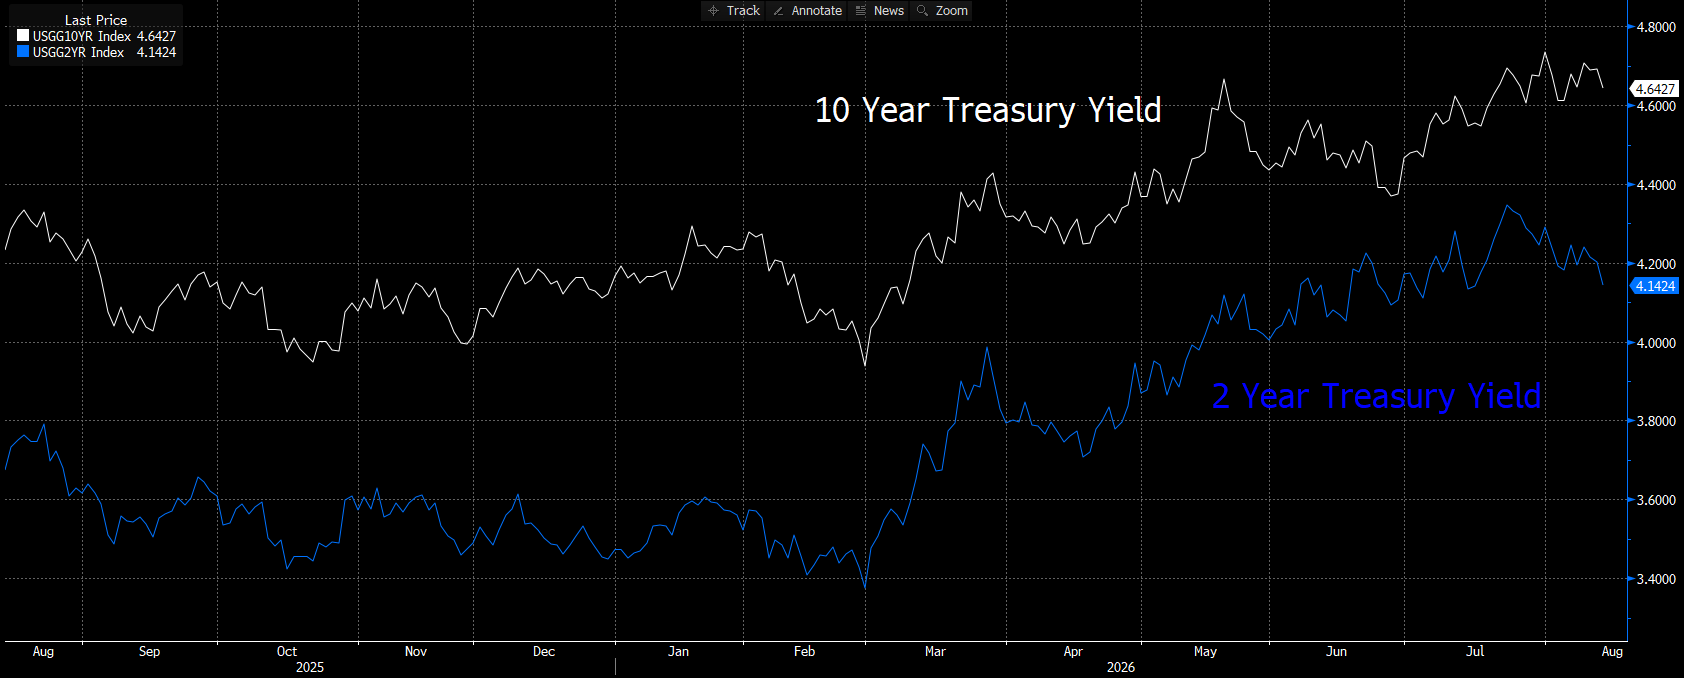
Here, I plotted yields of the 2-year and 10-year Treasury notes. The 10-year yield is sitting north of 4.6%, having climbed hard since this crisis escalated this spring, which is not the behavior of a market that’s relaxed about inflation risk, fiscal risk, or both. The 2-year, more tethered to what the Fed actually does with short-term rates, has climbed right alongside it, up over 4.1%. When both ends of the curve are marching higher together, that’s not a market pricing in rescue-cut optimism. That’s a market pricing in “rates stay higher for longer than you’d like,” full stop. And it lines up with what we’ve heard out of the new Fed chair’s corner office. Little if no appetite to cut into an inflation print that’s still running hot. This could be why the narrative has shifted to whether the next move is even in the other direction.
Here’s my read, and I’ll spare you the ferry-ride metaphor this time (you’re welcome). The stock market is currently pricing a version of the world where the Strait quietly reopens, oil behaves, inflation keeps drifting back toward target, and the Fed eventually gets room to ease. That’s not an impossible world. Corporate earnings have genuinely been solid this cycle, balance sheets among the mega-caps remain strong even as they lever up for AI infrastructure, and the labor market, while cooling, hasn’t cracked. There’s real substance under this rally, not just vibes.
But the bond market is pricing something closer to “this drags on, and the Fed has to stay disciplined whether it wants to or not.” And when I have to choose which market to trust on a slow-burning geopolitical and inflation story–the one dominated by algorithmic momentum and retail dopamine hits, or the one dominated by pension funds and central banks who get paid to be paranoid for a living–my friends, you know where my chips go. I want to forget that first chart, I just can’t unsee it.
So enjoy the all-time high. Genuinely, I mean that, maybe take the Millers out to dinner, let your thumb have its little BUY NOW victory lap. Just don't throw your phone in the ocean and declare the economy solved. Keep one eye on the Strait, one eye on that CPI print, and maybe give the corner gas station a friendly nod of respect next time you fill up, because it's working harder than your portfolio manager right now. The market can absolutely keep walking this wire for a good while longer. I'm just saying somebody should probably keep checking that the wire's still there–preferably not the same guy holding the dog bag and doom-scrolling his shopping cart.
YESTERDAY’S MARKETS
The S&P 500 rose 0.65% to a fresh closing high of 7,798.99, while the Nasdaq Composite gained 0.81%, and the Dow Jones Industrial Average added 69 points, or 0.13%, to 53,839. Brent crude fell more than 2% to settle at $87.07 a barrel, and WTI crude slid a similar margin to $81.25. The 10-year Treasury yield closed at 4.64%, with the 2-year at 4.14%. Strait of Hormuz crude tanker crossings remained near zero. 😉
NEXT UP
-
Retail Sales (July) are expected to have increased by 0.1% after climbing by 0.2% in June.
-
University of Michigan Preliminary Sentiment (August) may have eased slightly to 55.0 from 55.2.
-
Next week will feature another surge of important earnings along with housing numbers, PMIs, Leading Economic Index, and minutes from the Fed’s last meeting (the “friendly family argument” one). You better check back in next week if you want to be all the wiser.

 service@siebert.com
 Siebert Financial (800)872-0444