.png)

Financials Led Markets To All-Time Highs—And It Has Everything To Do With Interest Rate Mechanics.
KEY TAKEAWAYS
-
Markets hit all-time highs without the Nasdaq
-
Financials led both the S&P and the Dow
-
Bank stocks are up nearly 30% year to date
-
Rate cuts are lowering deposit yields, not mortgage rates
-
A steepening yield curve favors bank profitability
MY HOT TAKES
-
Lower rates are a feature, not a bug, for banks
-
The Fed is helping bank margins more than borrowers
-
Most investors misunderstand net interest margins
-
Watching tech alone creates blind spots
-
The yield curve remains the most important chart in markets
-
You can quote me: “When the yield curve steepens–banks print money.”
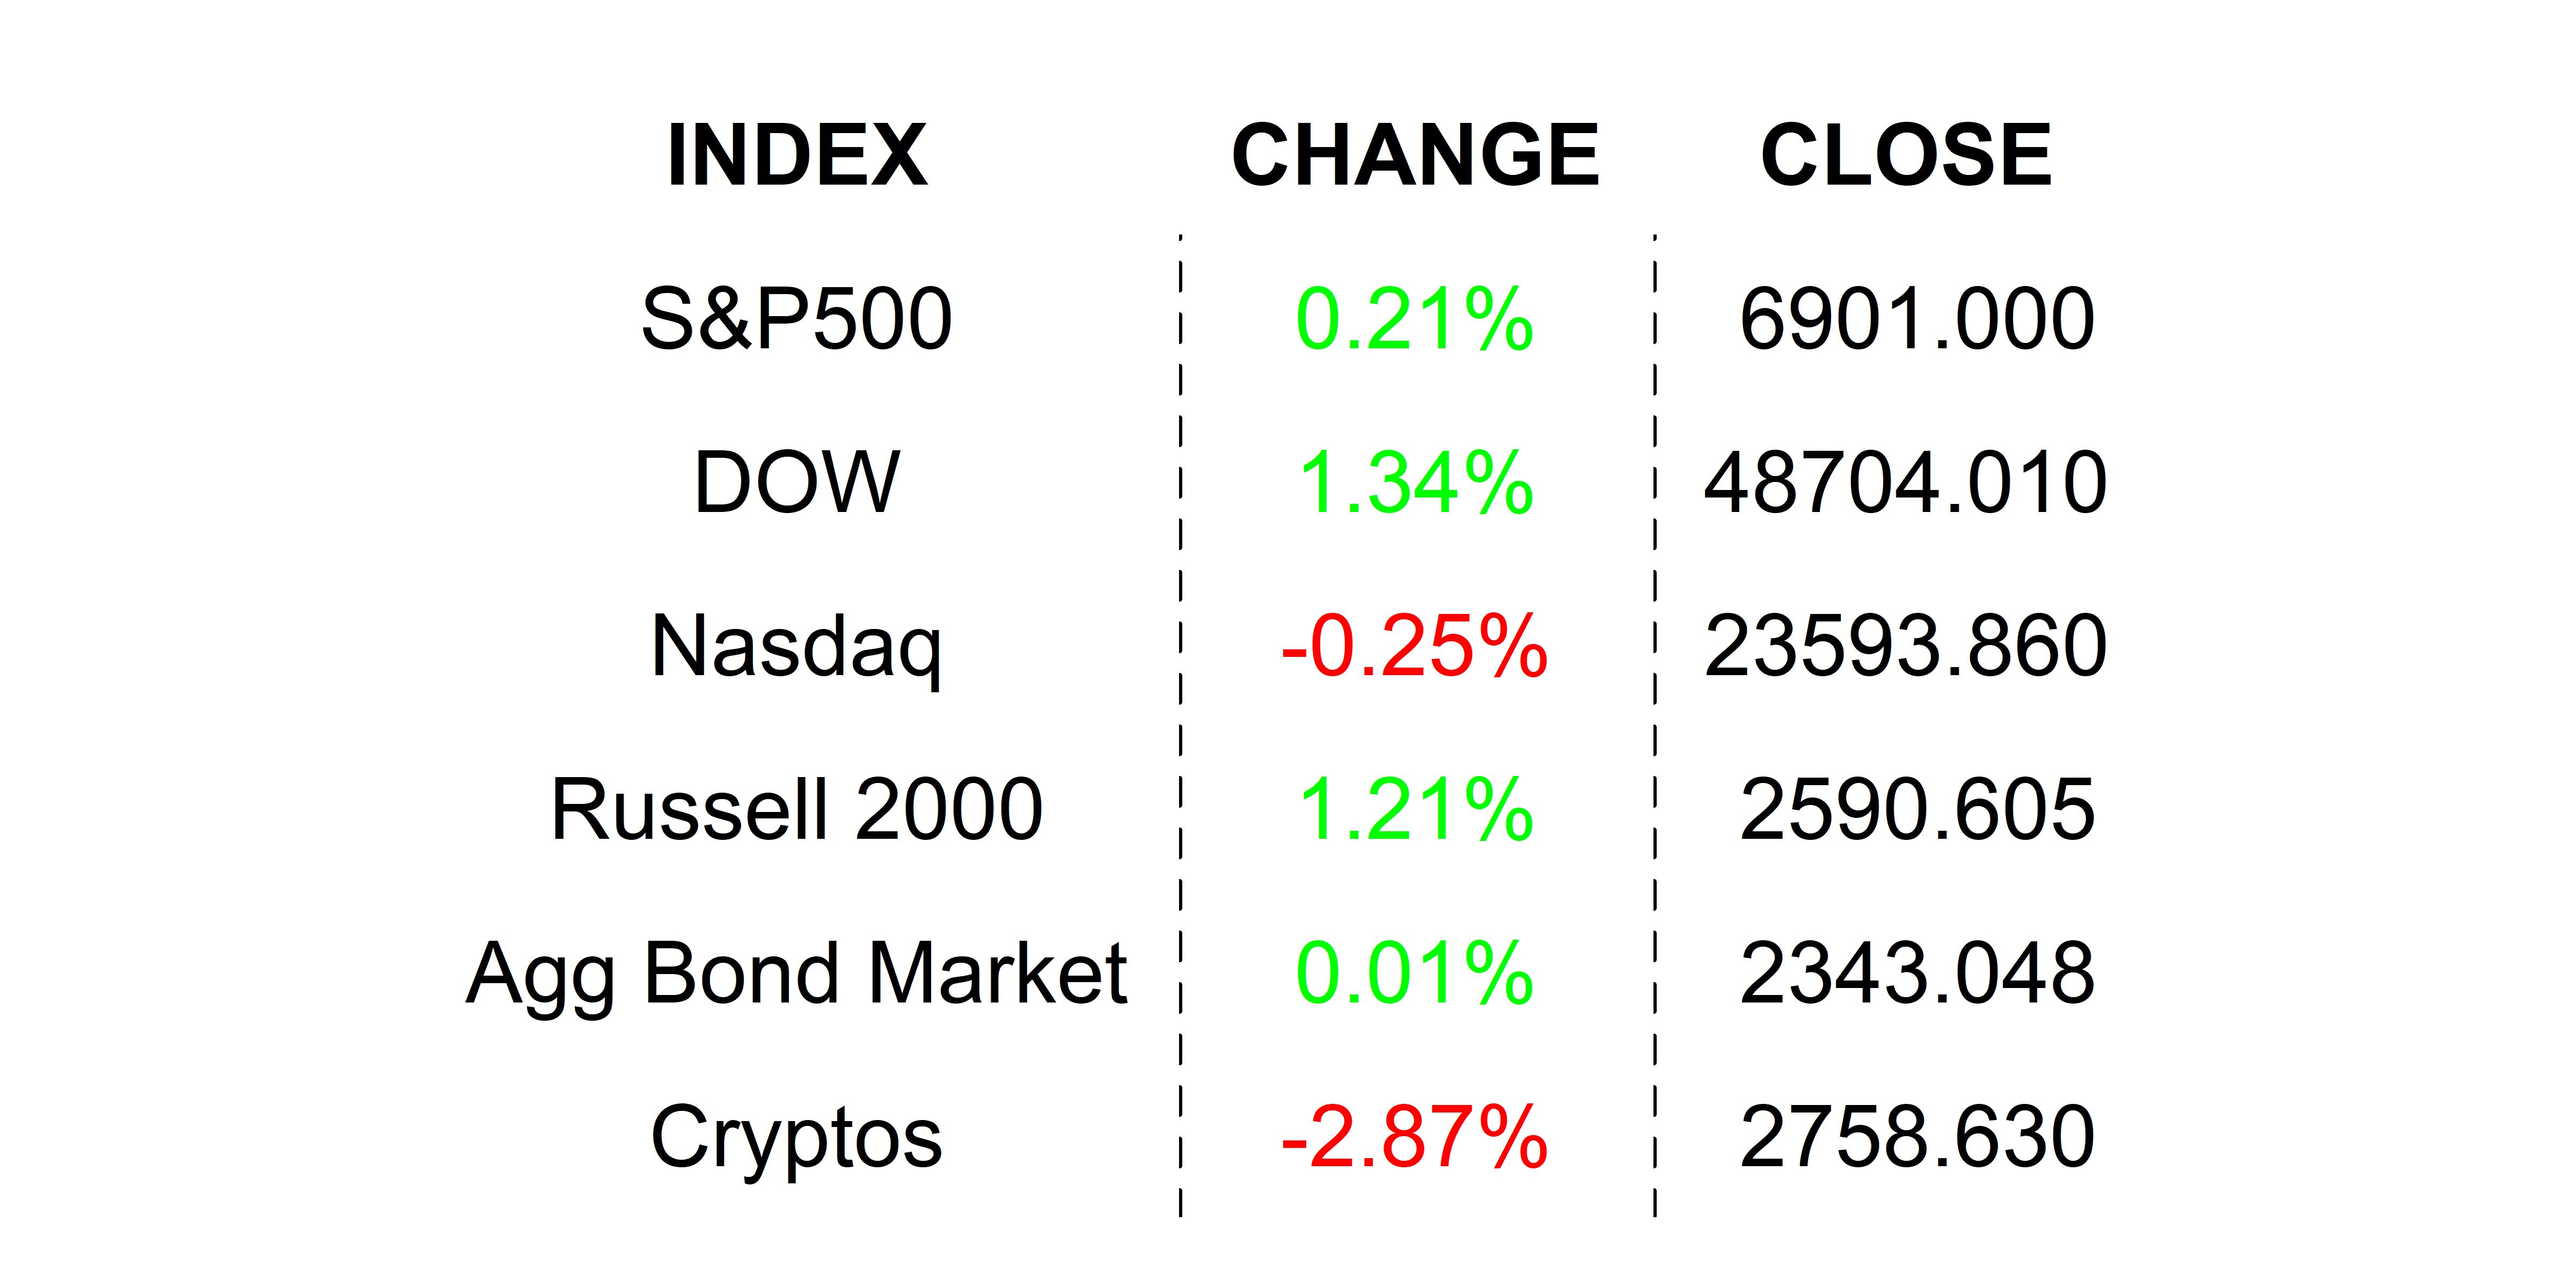
On the margin. If you were staring at your favorite tech stocks all day yesterday, you might have missed the big parade that rolled right past you. The Dow Jones Industrial Average, S&P 500, and small-cap Russell 2000 all closed at all-time highs yesterday. Were it not for Oracle’s lackluster earnings announcements on Wednesday night, the shiny, tech-heavy Nasdaq might have joined the party, but it wasn’t to be. That said, the S&P and Dow both have their share of shiny, high-tech flyers, but they both still managed to pull off record closes despite the heavy baggage. Looking across the S&P sectors, we note that financials stuck out as the winner, gaining 1.84%. Applying the same analysis to the Dow, the same leadership emerged with financials leading the pack with a 2.88% gain. Those gains certainly did not appear out of thin air. Let’s have a closer look.
First, we need to get something out of the way. The Dow’s 646-point 1.34% gain was certainly eye-fetching, but without looking at the Dow’s component weights, it is hard to understand what drove it. The Dow, unlike the S&P 500, is not a cap-weighted index. I don’t want to get into it today, but the Dow’s unconventional weighting method leaves financials with the most influence over the index’s performance. So, when financials outshine, the Dow is likely to have a good day. Yesterday was one of those days. Within the index, there are 4 financial stocks, Goldman Sachs, American Express, Visa, JPMorgan Chase, and Travelers. All of those were winners yesterday. Visa stood out with a 6.11% gain due to a favorable analyst upgrade, which heavily influenced the Dow’s performance. Within the group of financials, you may have noticed that there is only one bank, JPMorgan. JPM gained 2.34% yesterday to close just below its all-time high. That hints at the bigger story which I want to cover today. Have a look at this chart and keep reading.
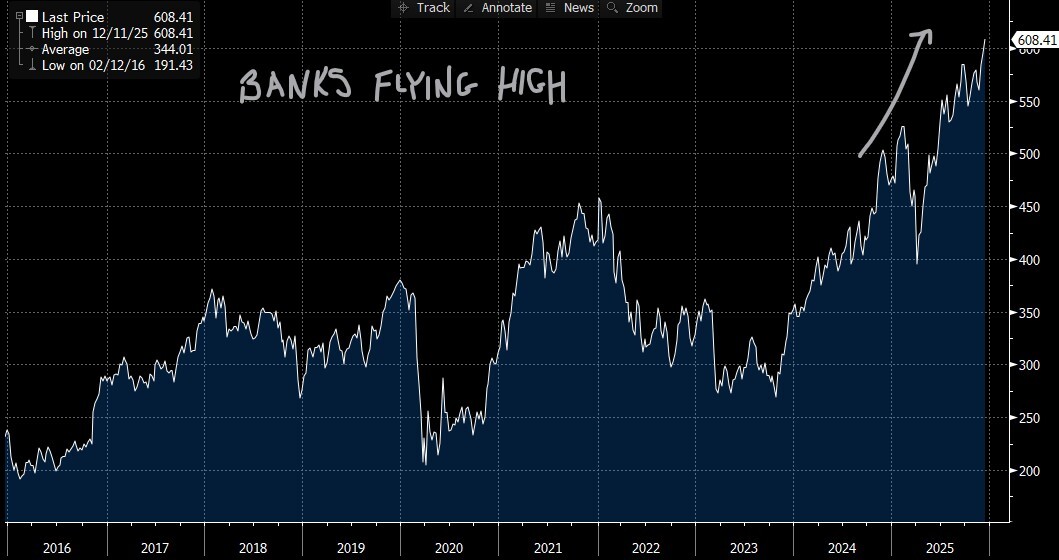
This chart shows the S&P 500 Bank Industry group, and you can see, just by eyeballing it, that the group is in the stratosphere, by 29% year to date. That compared to S&P 500’s 17% ytd is notable. What is it that caused the banks to rise to these heights this year? Well, it’s a tricky question to answer because all banks are different and each derives profits in slightly different ways, but I want to zero in on the core business of every bank–lending.
There is a common misconception that lower interest rates are bad for banks. Banks lend money, so if interest rates are lower, the interest that they charge for loans should come down, and ultimately cause the banks to be less profitable, right? Well, not quite.
Banks technically borrow money and then lend it out. They borrow money from you and me when we deposit our funds. They pay us interest, and I am sure that you noticed that the APY (annual percentage yield) you get for your deposits is far less than what you might pay for, say, a 30-year fixed mortgage. That differential–at the simplest level–is how banks make money. According to NerdWallet, the average national APY for deposits is 0.4%. In case you haven’t noticed, 30-year fixed mortgages are around 6.3% according to Bankrate. So, in a very simple world, banks borrow money from us at ½ a percentage point and loan it out at 6.3%. That 5.9% difference is pocketed by the bank! It is part of what is referred to as Net Interest Margin, a crucial metric in assessing a bank’s strength and performance. As you probably are well aware, while banks may have some latitude on borrowing/lending rates, it is the broader market that really governs them.
Mortgage rates are a hot topic these days. While 6.3% is not a crazy rate based on long historical standards, it seems like thievery based on more recent history where we saw mortgages around 3% just 5 years ago. In fact, 30-year mortgages were effectively lower than these current rates since 2001! Sure, they are better than the 8% peak rates of ‘23, but 6% mortgages are still lofty.
The Fed has been cutting interest rates over the past year or so, adding a sixth cut just earlier this week. Did these cuts have an impact on mortgage rates? A little bit, but less than many might expect. I recently wrote a piece and put out a video on how it is the Bond Vigilantes, essentially the bond market, that will impact mortgage rates and not the Fed. The reality is that the mortgage rates are impacted by 10-year Treasury Note yields and certainly not the Fed Funds rate, which the Fed–as its name implies–controls.
So, what does the Fed control? The Fed Funds rate influences, amongst many other things, short-term borrowing and lending rates. Those rates include–yep–the APY you get for your bank deposits. Read that again and think for a moment–go on. 👈 The Fed’s interest rate cuts may not be offering you relief, but rather, quite the opposite. You are getting less return on your bank deposits!
Let’s look at this from the other side of the story–banks have to pay less to borrow yours and my money. In that environment, if mortgage rates stay relatively stable, and banks have to pay less to borrow funds, the banks should be able to earn higher margins–net interest margins. To track this, we like to observe the treasury yield curve.
You hear me talking about the yield curve often. The slope and shape of the yield curve have importance that is far reaching, but banks and lending are right in the center of the target. Let’s have a quick look at the yield curve. Check it out then keep reading.
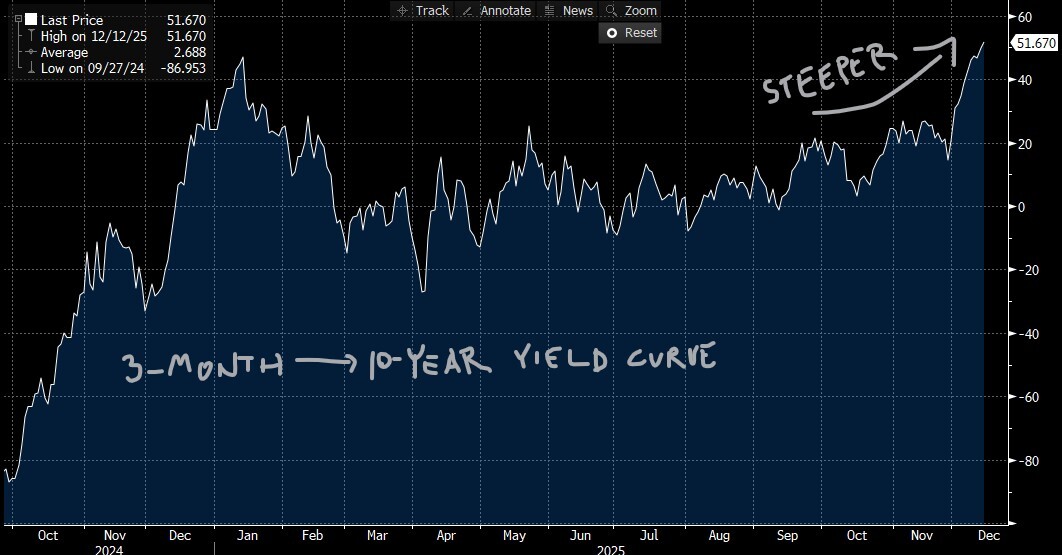
This is the 3-month -> 10-year yield curve. You can see by the chart how the curve steepened materially last year when the Fed started cutting interest rates. The curve’s steepness is measured by simply subtracting 30-month Treasury Bill yields from 10-year Treasury Note yields. If you have been paying attention to me ( 😉 ), you know that the Fed’s policy rates have a heavy influence over short-maturity yields like the 3-month bill. Longer maturity yields are under the care of the bond market.
The “bond market” pushes longer maturity yields around based on its assessment of term-premium (more perceived risk requires more yield), long-term inflation expectations (higher inflation requires more yield), and supply expectations (more government debt means higher yields). Can you see where this is going? Sure, you can. All three of those drivers, higher risk, higher inflation expectations, and larger deficits have kept longer yields stuck higher. Now take a look at this chart and follow me to the close.
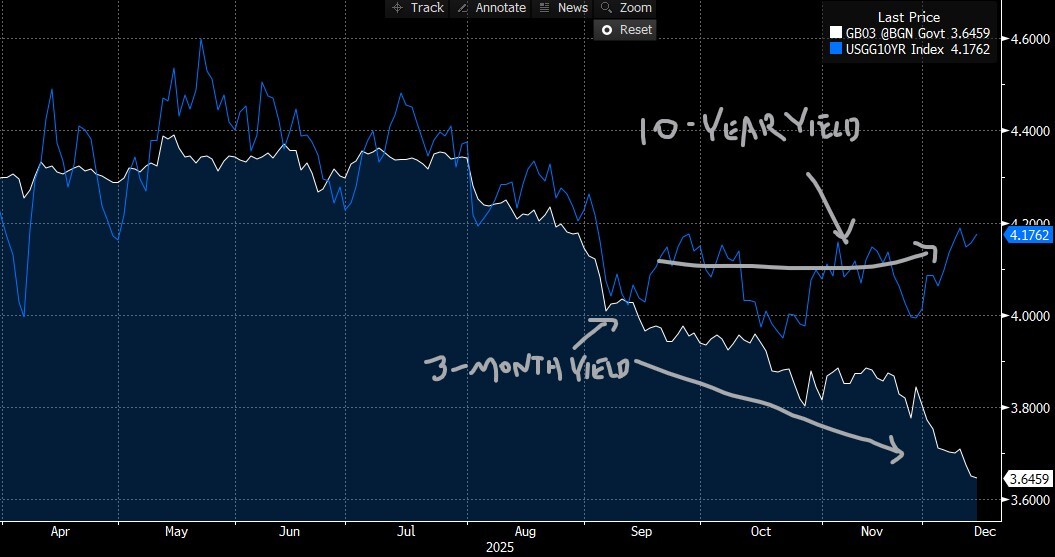
This chart is essentially the same as the prior yield curve chart, but here I separated out the components, so you can see why the curve steepened since August. You can see how 10-year yields (blue line) have essentially stayed constant while 3-month yields (white line) have traded lower. Those 3-month yields have moved almost in lock-step with increasing expectations of the recent wave of Fed rate cuts.
The result of all this churning has–some may argue–put banks in a better position to earn net interest margin. Now, while that may put some wind in the sales of banks, it is clearly not the only driver of bank earnings. Though lending is the core business of every bank, most make money on transaction fees, management fees, and trading profits. Transaction fees and management fees rise with capital markets strength. I am sure that you have noticed an increase in IPOs and M&A activity. Banks also make higher trading profits when markets are volatile, which I am sure does not surprise you.
This has been a year of strengthening capital markets, volatility, lower regulatory scrutiny on transactions, and a steepening yield curve. What that amounts to–from a bank’s perspective–is higher management fees, higher commissions, more transactions, greater trading profits, and HIGHER NET INTEREST MARGINS. Are you surprised that banks as a group are trading at all-time highs? It’s just basic math, stupid. 🤓
YESTERDAY’S MARKETS
Stocks had a mixed close yesterday–it was a tale of two stock styles with tech lagging and holding back the Nasdaq and the other hitting all-time highs. Afterglow from the Fed’s less-than-hawkish rate cut from Wednesday fueled investor confidence in cyclicals. Bitcoin managed to stay above 90,000, but it was touch-and-go earlier in the session.
NEXT UP
-
No economic data today, sorry, but next week will be chock-full of releases. We will get housing numbers (delayed), my new favorite ADP NER Pulse, official BLS labor numbers for last month (delayed from last week), Retail Sales, PMIs, Consumer Price Index / CPI, and University of Michigan Sentiment. Check back in on Monday for calendars–you will look smart with one in the right hand and egg nogg in the left. 😉