.png)
Strong payrolls grabbed attention, but the real story is slowing hiring, falling confidence, and rising risk of a Fed policy mistake.
KEY TAKEAWAYS
-
The March payroll headline looked strong at 178,000, but much of the gain came from categories that do not signal broad labor strength. Healthcare drove the number, and a meaningful portion of that came from Kaiser strike workers returning to existing jobs.
-
The unemployment rate looked better on the surface, but the household survey showed fewer people employed. The decline in unemployment came alongside weaker participation, not stronger hiring.
-
Broader labor stress is building beneath the headline. Discouraged workers, marginally attached workers, and people outside the labor force who still want jobs all moved higher.
-
The three-month pace of job creation has slowed materially compared with prior years. Long-term unemployment remains elevated, which raises the risk of deeper labor market scarring.
-
JOLTS data showed a hires rate near pandemic-era lows and a quits rate that signals weak worker confidence. Employers appear reluctant to add headcount, and workers appear reluctant to take risk.
-
Wage growth continued to cool, which gives inflation hawks some relief on demand-pull pressures. But rising energy and transportation costs could still keep inflation sticky in the months ahead.
-
The core market risk is a Fed policy mistake. If the Fed stays too tight for too long while the labor market weakens under the surface, the damage could spread into the broader economy and portfolios.
MY HOT TAKES
-
A strong economy is still the single most important support for markets, regardless of what investors own. That makes labor market quality far more important than a single flashy headline number.
-
Headline payroll data can create a false sense of confidence when the composition of hiring is weak. Surface-level beats are often the most dangerous when they distract from deteriorating trends underneath.
-
The labor market is no longer sending one clear signal. Payrolls, unemployment, household employment, hiring demand, and labor force attachment are painting a conflicted picture that investors cannot afford to oversimplify.
-
The Fed is now the main point of risk transmission. The problem is no longer just inflation, but whether policymakers are using backward-looking comfort to justify staying restrictive into a softening economy.
-
Energy-driven inflation is especially dangerous because it can keep prices elevated while labor conditions worsen. That combination would leave the Fed trapped and the economy exposed.
-
The bond market may have a cleaner read on the situation than equities right now. Watching the 2-year yield and curve shape may tell investors more than any polished headline or Fed soundbite.
-
You can quote me: ““But as any seasoned investor knows, the surface of anything on Wall Street is rarely where the truth lives.”
Hate to belabor the labor situation… but. I hope you had a restful and meaningful holiday weekend! Based on my video and readership trends since last Thursday SINCE THE MARKETS closed, suggests that you, my regular and longtime followers (I ♥️U), were very nervous about the employment situation DESPITE what appeared to be a homerun of a jobs number last Friday when the regular stock market was closed. Futures and bonds were open during the morning while the Bureau of Labor Statistics number dropped.
As I suggested a day earlier, if the headline numbers printed a meaningful beat we could see a mixed market result. On the one hand, if the labor market is strong, it is an undeniably good thing for the economy. And let me just say plainly that a strong economy is paramount for success in the market. I don’t care what you own in your portfolio–it has the best chance for success in a strong economy. Full stop. That said, of course, assessing the strength of the economy is not exactly cut and dry. Now, on the other hand, a strong headline print–implying a healthy labor market–provides cover for the Fed hawks who are content to “wait and see” what will be with things.
My long-time followers know that markets flip-flop constantly between “bad is good,” and “bad is bad." Lately however, trying to figure which one of those two regimes the market is in, has been pretty tough. Elevated Treasury yields suggest that the market is concerned with inflation, but a flattening yield curve suggests that the markets are concerned about the possibility of a policy error by the Fed. Stocks seem to be–well I can’t think of a better adjective than–nervous. Rightly so; there is a war raging in the middle east which has a major crude oil and LNG supply line completely shut down sending critical energy prices though the roof. And that war will end–who knows.
In these types of situations, we have been able to rely on the old Fed as a backstop for economic calamity, but the Fed, perhaps, not this time. Retail inflation has been creeping up and the sharp rise in gas prices hasn’t even hit the numbers yet. Further the expected rise in transportation costs had not yet propagated through the supply chain to hit you and me at the register.
Now if the Fed has a single mandate to worry about just inflation, the right answer is to do nothing, or even–I dare say–raise rates. That would absolutely cause the economy to go into a recession, and I can tell you that the most sure-shot way to cause deflation is a recession. But alas, the Fed has a dual mandate, with responsibility to maintain “full employment.”
On the surface that could mean keeping the Unemployment Rate at some natural level, defined mostly by its historical mean. But what if the Unemployment Rate along with the other closely watched Nonfarm Payroll Additions is not giving the Fed, and also importantly, us as investors, the full picture needed to properly assess the health of the labor market. In a minute I am going to get into last Friday’s BLS print, but first I want to remind you why we need to worry about the strength of the labor market. I will use two of my now famous quotes.
Confident consumers consume.
Employed consumers are confident.
There it is. Strong employment is absolutely critical for a growing economy! In normal times…wait, what am I sayin… I mean to say historically, all of these things operate in cycles and the Fed is able to work its magic to keep the tug-of-war relatively centered. But alas, these are not normal times. We now have artificial intelligence–AI in the mix, and it is completely changing the labor market beneath the surface. To be clear the net result will be very positive for economic growth driven by a surge in productivity. Notice how I said “net result,” because usually, major economic regime shifts like this start with losses. If you don’t believe me, look at how many companies have been announcing layoffs and citing productivity gains through AI. Go on, go and Google it–I can wait. 👀 Ok, enough of this, let’s dig further into Friday’s BLS’s monthly employment situation. Pay attention, this is important.
The headline print–178,000 nonfarm payroll additions, reversing February's revised loss of -133,000–looked, on the surface, like a genuine win. I understand why the hawks took a victory lap. But as any seasoned investor knows, the surface of anything on Wall Street is rarely where the truth lives.
Let's start with what was really driving those 178,000 jobs, because the composition tells a very different story than the headline. According to the actual release data from BLS, health care was responsible for 76,000 of those jobs. Of that 76,000, ambulatory health care services accounted for 54,000, and buried in that figure is the fact that 35,000 of those were simply Kaiser Permanente strike workers returning to jobs they already had. In other words, more than a third of the entire headline gain was a statistical snapback, not new economic activity. You cannot build a bull case on that. Construction added 26,000, transportation and warehousing contributed 21,000, and social assistance tacked on another 14,000. Federal government employment, meanwhile, continued its now well-established decline, shedding another -18,000 jobs in March. Since reaching its peak in October 2024, federal government employment is down 355,000, which is an -11.8% contraction in just five months. That is a historically large drawdown of a workforce that, for decades, provided one of the most stable employment foundations in the country.
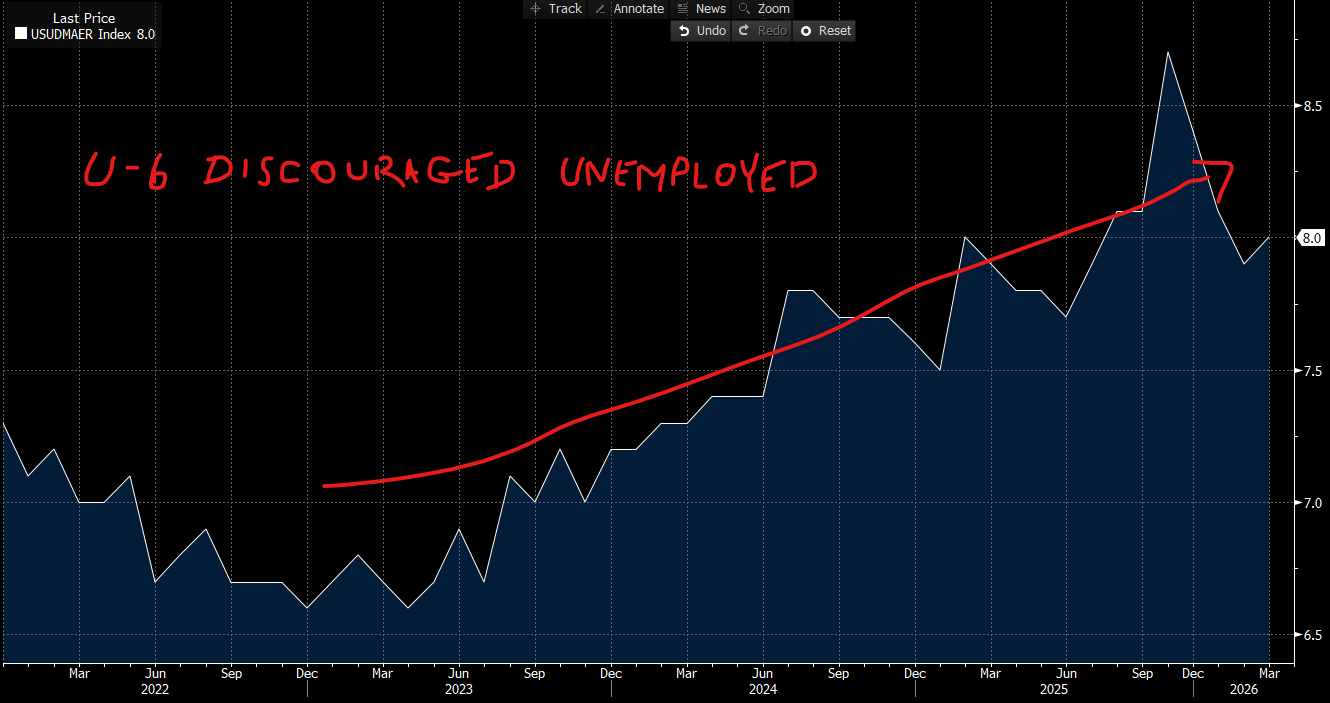
Now, the unemployment rate. The headline ticked down to 4.3%, and most of the mainstream media was positively giddy. But here is the thing. The BLS household survey–the one used to actually compute the unemployment rate–showed 64,000 fewer people holding jobs in March, not more. The unemployment rate did not fall because more Americans got hired. It fell because more Americans stopped looking for work. That is not a healthy labor market. That is a discouraged labor market. And the BLS publishes a separate, far more honest metric to capture exactly that reality. The U-6, which counts discouraged workers and those stuck in part-time positions when they want full-time work, edged up to 8.0% in March, even as the headline U-3 ticked down. That divergence between U-3 and U-6 is a warning sign hiding in plain sight.
Speaking of discouraged workers, the BLS reported that this group jumped by 144,000 in a single month to 510,000 in March. The number of people marginally attached to the labor force (those who want work, have looked for it in the past year, but have simply stopped trying) increased by 325,000 to 1.9 million. Then there is the 6.0 million Americans who are not in the labor force at all but say they currently want a job. None of these people show up in the headline unemployment rate. None of them generate political alarm the way a rising U-3 does. But they absolutely represent real human beings who are not participating in the economy the way my two famous quotes from above ☝️🙃 require for a growing economy. These folks are neither employed nor confident.
Then there is the three-month trend, which is what every serious economist I respect watches above all else. A single month's print is a data point. Three months is a trend. The BLS itself noted that payroll employment had changed little on net over the prior twelve months. When you do the math, the three-month moving average for job creation so far in 2026 sits at roughly 68,000 per month, which is a pace that is less than half of what we saw just two years ago. One strong month does not erase that reality. And long-term unemployment–those out of work for 27 weeks or more–held at 1.8 million in March, up 322,000 from a year ago, and now accounts for 25.4% of all unemployed workers. Long-term unemployment is particularly damaging because the longer someone is out, the harder it is to get back in. Skills can atrophy and networks evaporate. These are not people in a temporary transition. These are people increasingly at risk of being left behind permanently.
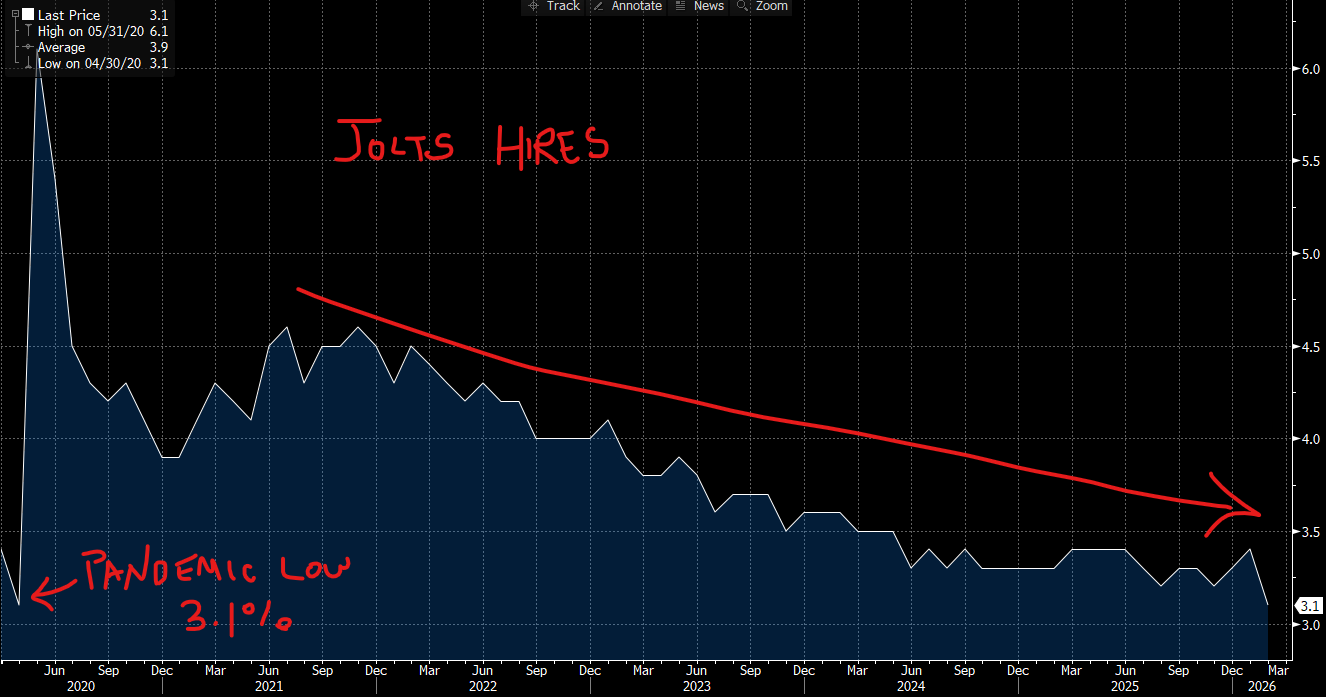
And then there is the JOLTS data, which arrived last week just days before the March employment report and which, in my view, tells the most honest story of all about the actual state of hiring demand in this country. The February Job Openings and Labor Turnover Survey (JOLTS) showed that the hires rate fell to 3.1%, matching the lowest reading recorded since April 2020, when the economy was physically shuttered during the pandemic. Total hires dropped to 4.8 million, and job openings held at 6.9 million. Let me put that hires rate in context for you. In April 2020, businesses were locked. Nobody was going anywhere. Nobody was hiring because nobody was open. Today, restaurants are full, office buildings are occupied, and yet employers are still barely bringing anyone on board. That is not a healthy labor market in disguise. That is a labor market where risk aversion has set in so deeply that businesses would rather run lean than commit to new headcount. The “quits” rate–historically one of the best real-time measures of worker confidence, because people quit when they believe better opportunities exist–held at just 1.9%, also near multi-year lows. Workers do not quit when they are nervous. And right now…er, they are nervous.
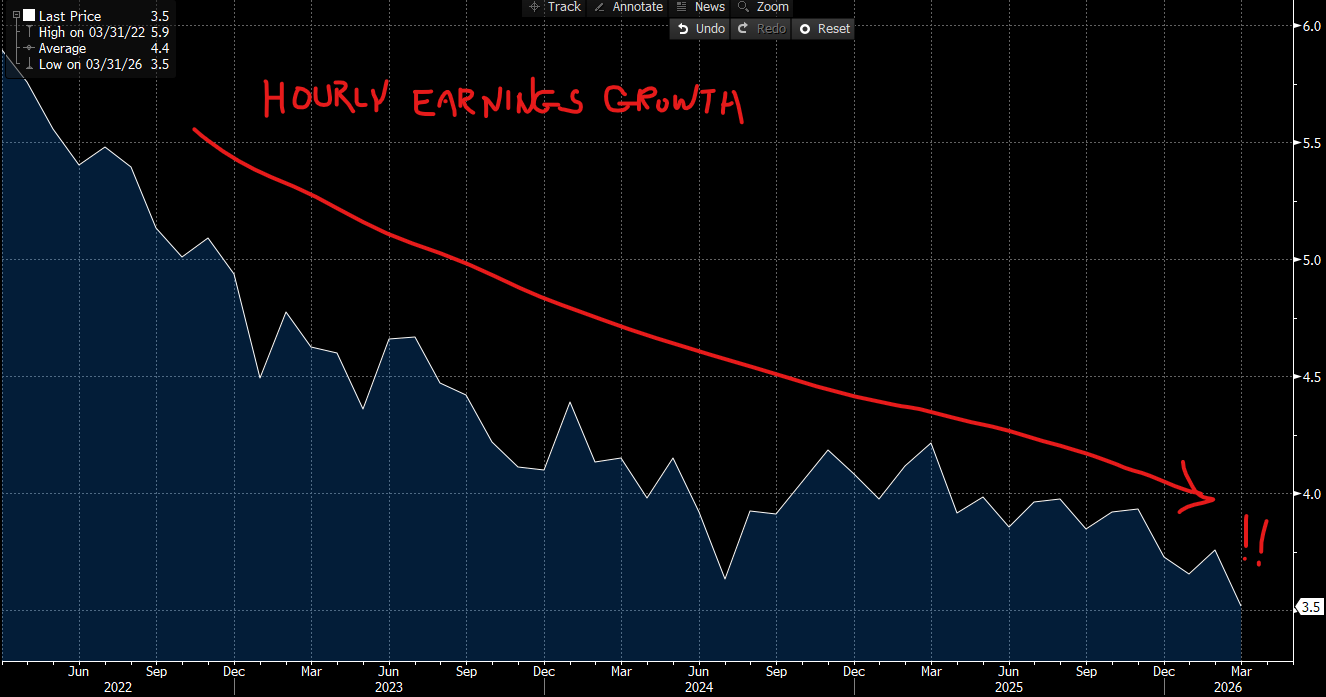
What all of this does, unfortunately, is give the Federal Reserve hawks exactly the permission slip they were looking for to stay on hold indefinitely. Wage growth came in at 0.2% for the month and 3.5% year-over-year, with average hourly earnings rising to $37.38, according to the BLS establishment survey data. The annual wage growth pace of 3.5% is the lowest since May 2021, and it came in below the consensus expectation of 3.7%. THIS IS IMPORTANT: the inflation picture from wages is moving in the right direction for the inflation hawks; wage growth is a primary catalyst for the most dangerous inflation, demand-pull inflation.
The front-and-center problem is that energy prices are roaring, transportation cost pass-throughs are still working their way through the supply chain, and the March survey was conducted before the most acute effects of the energy shock from the conflict in the Middle East had time to fully register in economic behavior. Those effects are coming. They will show up in the April data, released in May, and that report could be a very different conversation.
Here is where the real risk lives now, and this is critical for you to understand as investors. The debate has shifted away from whether the Fed will raise rates, and entirely toward whether the Federal Reserve is in the process of committing a catastrophic policy mistake by keeping monetary conditions this tight, for this long, against an economy that is softening beneath the headline numbers. A labor market where the hires rate matches pandemic-era lows, where discouraged workers jumped by 144,000 in a single month, where the three-month trend is a fraction of what it was in 2023 and 2024, and where the household survey is actually showing fewer people employed. My friends, that is not the robust labor market the hawks are pointing to. And if the Fed is wrong, if they hold too long while energy-driven inflation does the heavy lifting on prices, the combination of tightening monetary policy and a deteriorating labor market could be severely damaging to the economy and, by extension, to your portfolio. I want to make this clear; the Fed is where the responsibility lies at the moment–though many would turn this into a politically-driven discussion.
The good news–and there is always a path forward for the prepared investor–is that this week's economic calendar is going to tell us a great deal. The March Consumer Price Index / CPI drops on Friday, and that number carries enormous weight right now. If inflation continues to climb, driven by energy, the hawks have their cover locked in for months. If it prints softer than expected, the conversation about a Fed policy error accelerates rapidly, and the bond market–right now the smartest market in the room 😉–will respond accordingly. Watch the 2-year Treasury yield as your real-time barometer of Fed rate expectations, and watch the spread between the two-year and the ten-year. That relationship will tell you more about where this economy is heading than any single statement from a Fed official. The data will speak. Let's listen carefully. Ok, now you can drink your morning coffee–I am certainly ready for my second cup–or is this the third. 🫨
THURSDAY’S MARKETS
Thursday's session was volatile, with all three major indexes staging a dramatic intraday recovery after early losses of more than 1.5%. The Dow Jones Industrial Average closed down by -0.13%, while the S&P 500 edged up 0.11% to 6,582.69 and the Nasdaq gained 0.18%. The rally off the lows was sparked by reports that Iran was drafting a protocol with Oman to allow ship traffic through the Strait of Hormuz. For the shortened holiday week, the S&P 500 gained 3.4%, the Dow rose nearly 3.0%, and the Nasdaq led with a gain of 4.4%, snapping an ugly losing streak. On Friday, markets were closed but futures–open for the morning–fell in response to the hot labor print.
NEXT UP
-
ISM Services Index (March) may have slipped to 54.9 from 56.1. Watch the Prices Paid component–expected to have risen to 76.0 from 63.0.
-
The week ahead is jam packed with market movers, including ADP NER Pulse, Durable Goods Orders, Consumer Credit, FOMC Minutes, Personal Income, Personal Spending, GDP, PCE Price Index, Consumer Price Index / CPI, and University of Michigan Sentiment.
\