
.png)
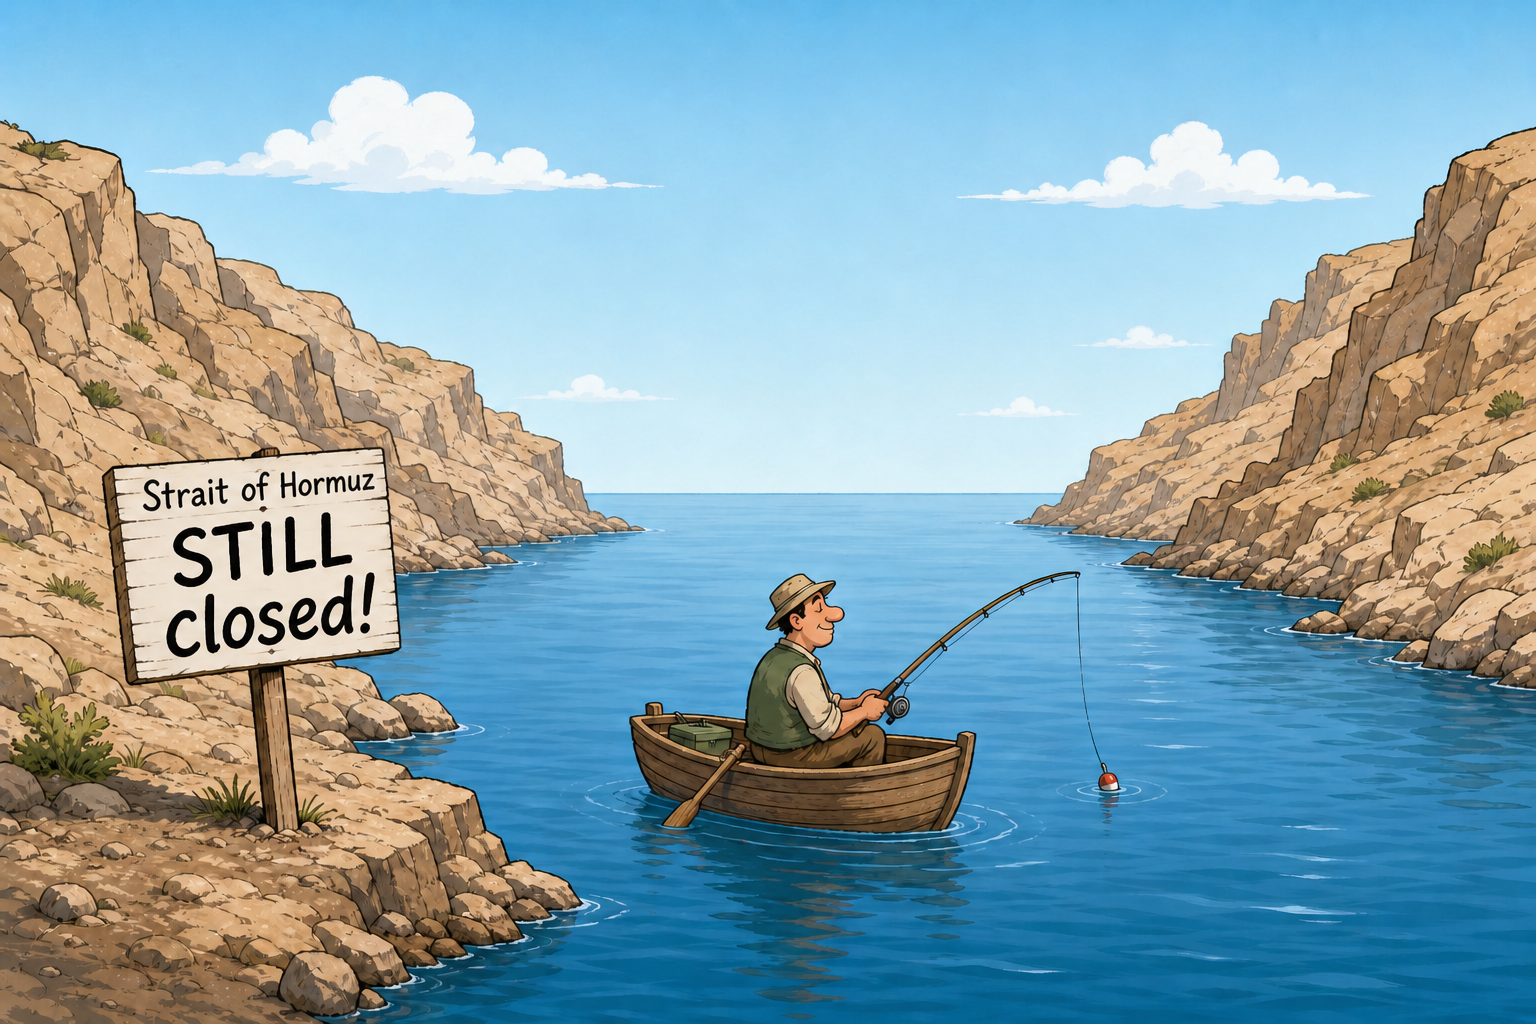
A dramatic divergence between tanker traffic and stock prices raises uncomfortable questions for investors.
KEY TAKEAWAYS
-
The physical energy market and the financial markets are sending completely different signals. Tanker traffic through the Strait of Hormuz remains severely disrupted despite equity markets reaching new highs.
-
Oil futures reflect expectations about the future, while physical oil prices reflect current supply conditions. Investors often overlook this important distinction.
-
The market has repeatedly interpreted diplomatic announcements as supply improvements, even though actual oil shipments have remained largely stalled. Headlines and logistics are not the same thing.
-
The Federal Reserve is likely to remain focused on inflation if energy disruptions persist. That could delay or even reverse expectations for lower interest rates.
-
Long-term investors shouldn't panic, but they should recognize that markets sometimes ignore economic realities longer than expected. Eventually, those gaps tend to close.
MY HOT TAKES
-
Markets have become overly dependent on optimistic narratives rather than observable economic data. Physical supply chains deserve more attention than daily headlines.
-
Investors should spend less time watching oil futures and more time watching actual energy flows. Reality often shows up there first.
-
The AI boom has created enough optimism to temporarily overwhelm macroeconomic concerns. That doesn't mean those concerns have disappeared.
-
The biggest risks often emerge when financial markets and real-world conditions diverge dramatically. Those disconnects rarely persist forever.
-
Successful investing requires separating hope from evidence. When those conflict, evidence usually wins in the long run.
-
You can quote me: "What wins, the tankers or the (AI) tokens?"
I want to believe. I want to believe that the struggle in Iran is over and that inflation will recede back along with fuel prices and yields. I want to believe the Fed will realize that the labor market is limping and cut rates. If I–like most folks out there–just watched the stock market over the past several weeks, I would indeed believe that the crisis is over. I could move on and get back to business as usual with my investments, my everyday purchasing habits–my life. I could claim victory for having stayed in the market and even bought the dip–and even better–followed the analysis I laid out for you weeks prior to the first airstrikes on Iran back in February. But the reality suggests otherwise. I have been trying to convey this feeling for many weeks, but last week I plotted a chart on my Bloomberg. This one chart, which turned into two, told me everything I suspected all along. I can't unsee what is in these charts. Have a look at the first, and keep reading.
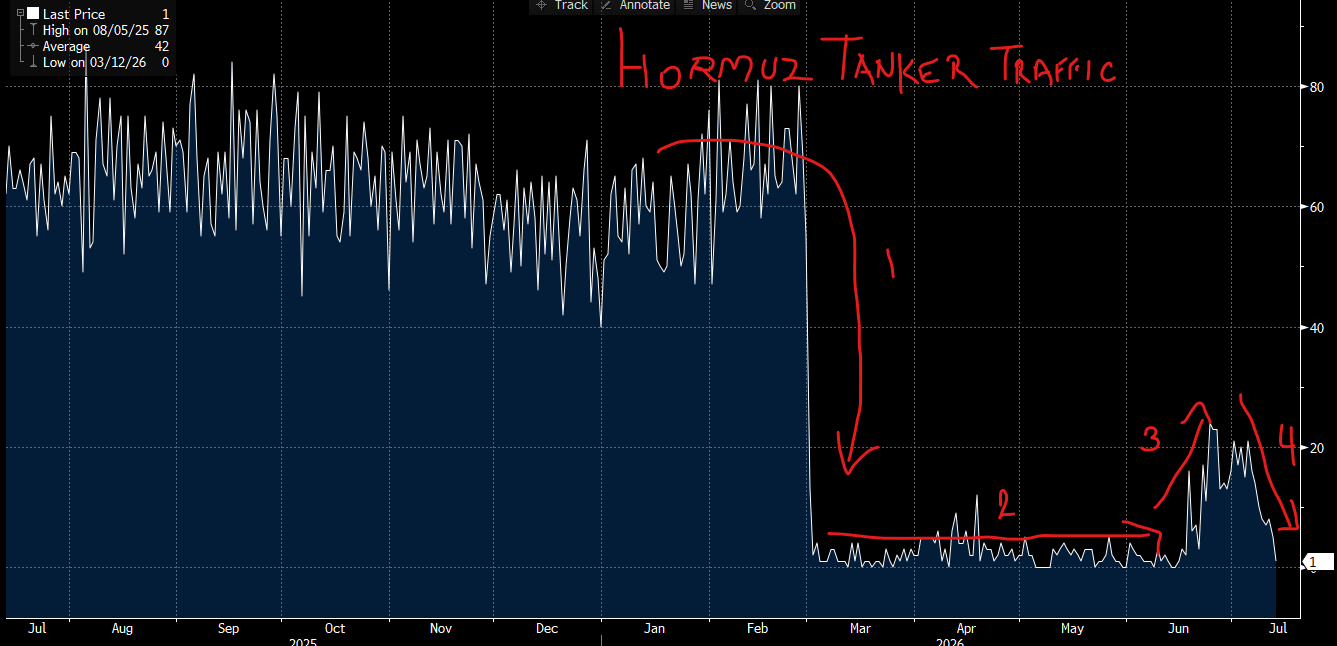
That first chart is not a forecast model. It's not a sentiment survey. It's not a futures curve pricing in what traders hope will happen. It is a head count. Tankers. Moving through the Strait of Hormuz. Real ships, with real barrels, heading to real refineries. And what it shows is one of the most dramatic supply disruptions in the history of global energy markets—playing out in near-silence, while equity markets printed new highs. Let me walk you through the four acts of this particular tragedy.
Going back to the summer of 2025, tanker traffic through the Strait of Hormuz was running in its normal range–roughly 60 to 80 transits at the peaks, with typical weekly volatility. This is the baseline. This is what "normal" looks like for a waterway that, before the conflict began, carried approximately 17-20% of the world's oil and liquefied natural gas. One in five barrels of petroleum moving across oceans passed through that 21-mile chokepoint between Iran and Oman.
Then came late February 2026. The U.S. launched strikes against Iran on February 28th. Within 72 hours, the IRGC had mined portions of the strait, attacked tankers, and issued warnings that any vessel transiting toward American or Israeli-allied ports did so at its own mortal risk. By March 1st and 2nd, no ships were moving at all. What had been 60-to-80 transits collapsed (red arrow 1 on the chart) to essentially zero. The IEA would later characterize the subsequent supply disruption as the largest in the history of the global oil market. That is clearly not hyperbole, especially viewed on the left-hand side of this chart. The IEA is not an institution known for understatement acknowledging that something genuinely historic had just happened.
That flat, near-zero line running from March through May (red arrow 2 in my chart) represents weeks of near-total Hormuz paralysis. Ceasefires were announced. Ceasefires collapsed. A U.S. naval blockade of Iranian ports went into effect in April. Pakistan served as mediator, shuttling proposals between Washington and Tehran. Every time a diplomatic signal emerged, oil futures fell, because paper traders repriced hope. But the tankers DIDN’T move.
Red arrow 3 in my chart reflects what happened in June after the Islamabad Memorandum of Understanding was signed on June 17th. Traffic briefly recovered to perhaps 20-24 transits, which was encouraging, but a fraction of pre-war levels. And finally, red arrow 4 tells you where we are this morning. One tanker. That's it. Traffic has collapsed back to the floor after Iran closed the strait again over the weekend, firing a warning shot at a vessel attempting to use an unauthorized route and declaring the waterway "not possible" for passage. The ceasefire, per President Trump's own statement last week, is effectively over.
As I write this Monday morning, U.S. and Iranian forces exchanged fresh strikes over the weekend. Oman is drafting a tentative proposal to manage traffic through two separately controlled routes. Iranian Foreign Minister Abbas Araghchi is traveling to Muscat. The diplomats are working. The tankers are not moving. Have a look at this next chart and follow me to the finish.
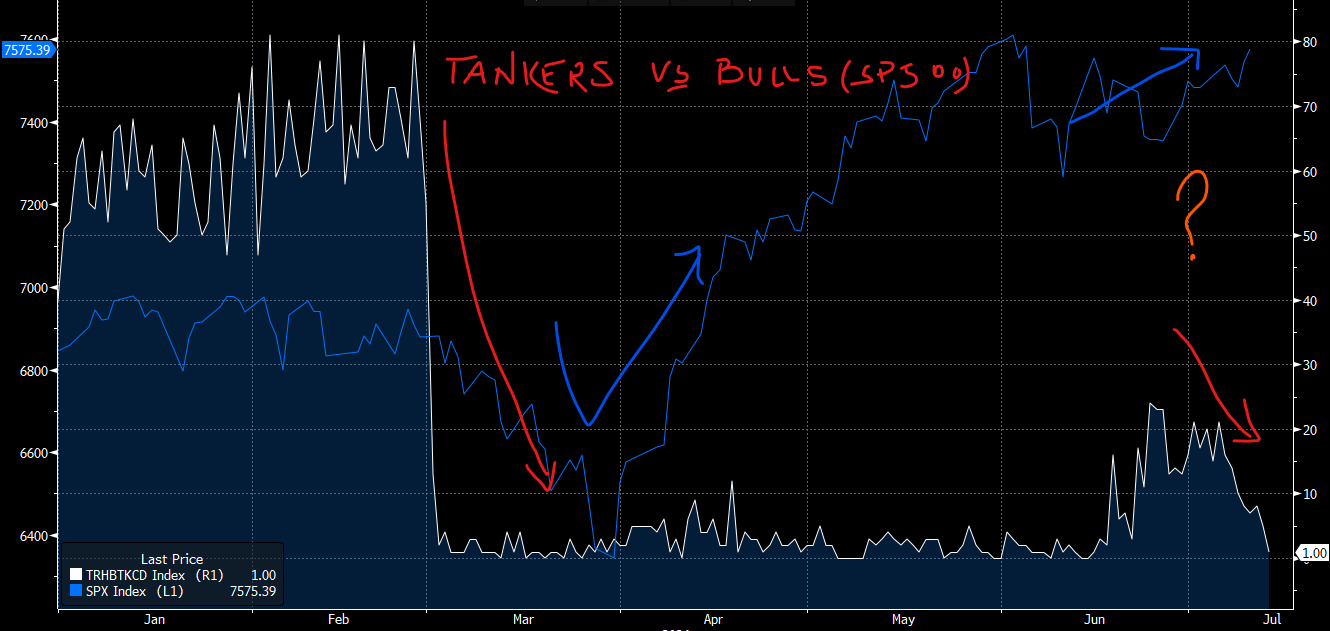
This chart–"Tankers vs. Bulls"--overlays the same tanker traffic data in white against the S&P 500 in blue. And here is where the cognitive dissonance becomes almost impossible to ignore.
When the strait went dark in early March, the S&P 500 fell. That made sense. The index hit a local trough roughly a month later, in early April. Markets were processing the shock. Supply lines were severed. Inflation was re-accelerating. The Fed, under newly installed Chairman Kevin Warsh, was making clear that "price stability" was the only mandate it intended to honor without qualification, with his first FOMC statement pared to 132 words, all forward guidance stripped, nine of nineteen members already penciling in rate hikes by year-end. The bar for cuts had effectively been removed from the menu.
Then, miraculously, or maybe not so miraculously, the S&P rallied. Sharply. All the way to the right of that chart (the blue line) the index is sitting near record territory at roughly 7,575 as of Friday's close. The blue arrows trace the recovery: an AI-driven surge, earnings optimism, the brief sugar high of the Islamabad MOU signed June 17th, and a broader narrative that the worst was behind us. "The strait is open," was the official statement. "We have a deal," the headlines said. Equity traders took the cue. I almost believed it to be true, but something told me that this chapter was far from over.
Check out the white line underneath that entire equity recovery. Tanker traffic barely moved. The "reopening" never materialized in any meaningful way. The strait went from zero to a brief flicker–and now back to zero. The S&P 500 rallied 20 percent above its year-ago level while the physical flow of one-fifth of the world's seaborne oil remained essentially blocked.
The orange question mark annotated on the right-hand side of this chart is mine. It belongs to all of us. Now what? What wins, the tankers or the (AI) tokens?
Here is something the mainstream narrative keeps glossing over, because it requires a bit more explanation than a price ticker allows: when you hear that crude oil is trading "in the low seventies," you are hearing about the paper price. The futures price. The price of a contract on a screen in New York or London for barrels of oil to be delivered at some future date–a date that assumes, implicitly, that those barrels will in fact be available to move.
The physical price of oil is a different animal entirely.
In the acute phase of this crisis, physical Dubai crude–the barrels Asian refiners actually need, sourced from the Gulf, delivered on tankers, traded at premiums of $37 to $40 per barrel above equivalent futures contracts. At the peak, physical spot cargos changed hands north of $140 per barrel while futures sat around $100. North Sea Forties touched $147. This is not a rounding error. This is the market screaming that real barrels are scarce while financial contracts price diplomatic optimism.
Think of it this way: the futures market is a bet on the future. The physical market is the present tense. And the present tense, for most of the past four months, has been a near-total blockade of the world's most critical energy chokepoint. War-risk insurance premiums for Hormuz transits surged from roughly 0.125% of hull value pre-conflict to as high as 5% at the peak. That translates to roughly $5 million in additional cost per supertanker transit, when insurers were willing to write coverage at all. All the major shippers suspended transits entirely and rerouted through the Cape of Good Hope, adding 3,800 nautical miles and some 2 weeks to every voyage.
Futures traders can price ceasefire announcements in minutes. Mines take weeks to sweep. Insurance actuaries move on a different calendar than press releases. Tanker crews need certified safe passage, not a tweet. The physical market and the paper market are operating on fundamentally different timescales, and the paper market has consistently treated every diplomatic headline as a supply signal. It is not.
Diplomatic signals are not supply signals. A ceasefire announcement drops paper crude prices within hours. Only completed mine-sweeping, active P&I coverage, and physical tanker movements restore actual supply. We are nowhere near that.
And yet WTI futures are sitting around $73 this morning, near the low end of their range despite fresh strikes over the weekend and tanker traffic at a single-vessel level. The market is, once again, pricing hope. Once again pricing a resolution that, as of this morning, does not exist.
Meanwhile, the Fed is watching all of this through the lens of a mandate it has now stated, in Chairman Warsh's own unhedged language, with extraordinary bluntness: "This committee will deliver price stability." No qualifiers. No "while also supporting maximum employment." Just that sentence, standing alone, in a statement that was otherwise pared to 132 words. Nine of nineteen FOMC participants have already penciled in at least one rate hike by year-end. Inflation, as measured by the CPI, hit 4.2 percent in May—a three-year high, driven in large part by energy prices that jumped by some 23%.
So here is where I find myself this morning, unable to unsee what these charts are telling me. The labor market is in what Warsh himself described as a "low-hire, low-fire holding pattern." The Millers–your average dual-income household carrying a car note, a mortgage reset, and a credit card balance that keeps creeping higher–are not feeling the AI rally. They are feeling $4 gas, elevated grocery bills, and a Fed that has explicitly told them it will prioritize price stability over their job security.
The S&P 500, now north of 7,500 on the strength of AI capex optimism and bank earnings season kicking off this week with JPMorgan, Goldman, and the rest reporting Q2 results–is putting a lot of faith in the convenient narrative. It's betting the Hormuz situation resolves cleanly. It's betting Warsh blinks. It's betting that the physical supply crunch bleeding through into actual consumer energy costs gets resolved before it shows up conclusively in forward earnings.
Maybe it does. Maybe the Oman proposal works. Maybe the Iranian Foreign Minister's trip to Muscat yields something durable this time. Maybe CENTCOM and the IRGC find a way to share that 21-mile passage without incident. I want to believe.
But the chart with the white line and the blue line is staring back at me. The white line is at 1. ONE! The blue line is near all-time highs. One of them is right. The other one is going to have to move.
The question worth asking, the one that doesn't get asked enough in a market that runs on narrative, is simple: what does the S&P 500 do when paper oil finally catches up to physical reality? When the tanker count is the input variable and not the footnote? When Warsh looks at an energy-driven inflation print that refuses to cooperate with his timeline, and nine committee members who were already whispering about hikes stop whispering?
To be clear, this is in no way a sell signal intended to cause you to panic. In fact, if you are long-term oriented–as I ever suggest you should be–you owe it to yourself to look at both lines on that chart and ask honestly which one is pricing reality. Because in my experience, markets can sustain cognitive dissonance for a surprisingly long time—right up until the moment they can't.
I want to believe, but I just can't unsee those lines.
FRIDAY’S MARKETS
On Friday, the S&P 500 gained 0.42%, notching a weekly advance of more than 1% on the strength of AI-driven tech names, with NVIDIA up roughly 4% and Meta surging 6% on the week. The Dow added 150 points to settle at 52,637, and the Nasdaq Composite closed up by 0.29%. The 10-year Treasury yield eased to 4.56%, retreating from the week's highs as oil prices pulled back on reports that U.S.-Iran diplomatic talks would continue despite renewed hostilities.
NEXT UP
-
No major economic releases today, but the week ahead is chock full. Earnings season starts with the big banks leaving the gate first. Numbers include CPI / Consumer Price Index, PPI / Producer Price Index, Retail Sales, housing numbers, and University of Michigan Sentiment. Don’t forget Fed speakers–there are only a few days left to talk their positions ahead of the mandatory press blackout period that precedes their July FOMC meeting. I am sure they have a lot to say. Fed Chair Walsh will testify for the first time as Chairman on Capitol Hill–don’t you dare miss this one. In fact, don’t miss a single post this week–if you like being ahead of the 8-ball.

 service@siebert.com
 Siebert Financial (800)872-0444