Consumer pullback, price hikes, and a trip down memory lane—today’s market note frames the retail story in three charts.
KEY TAKEAWAYS
-
Retail Sales fell -0.9%, worse than expected, with declines in key categories like autos and building materials
-
Nonstore retailers (e.g., Amazon) were the only positive standout
-
Three-month trend across major retail segments is turning negative
-
Auto prices have risen significantly, suggesting price sensitivity is driving consumer pullback
-
Tariff anticipation likely caused a March auto-buying surge, followed by a steep drop in April and May
MY HOT TAKES
-
Consumers are price sensitive––and that sensitivity is showing up in big-ticket items
-
Tariffs are working their way into prices, and it’s starting to hit demand
-
Retail Sales may be flashing the first real signs of economic weakness
-
We’re not in crisis—but this is how one starts: quietly, with a few overlooked charts
-
A chart may not scream––but it can whisper, and right now, it’s saying “pullback”
-
You can quote me: “Pictures are important, so is the context around them.”
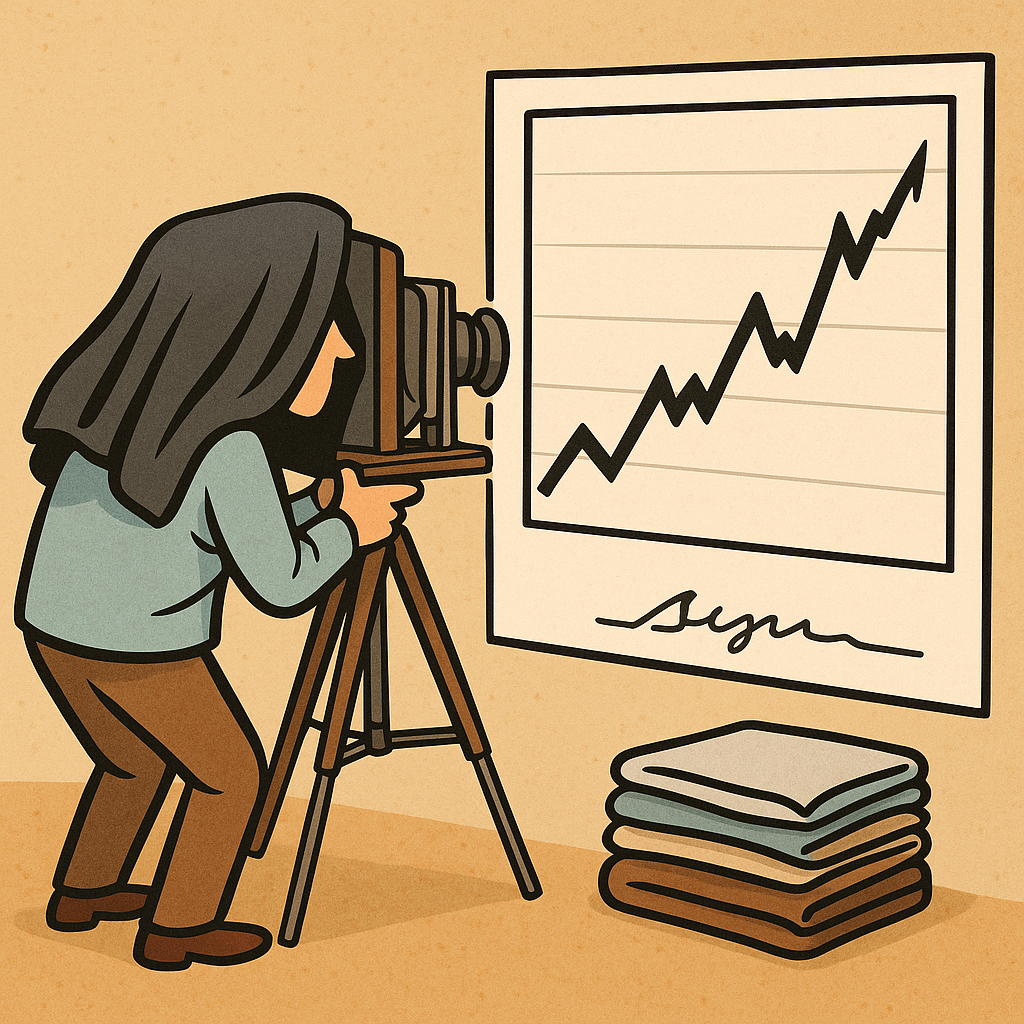
Picture this. It’s picture day! Back in the day, your teacher would ask the class pet-student to hand out a stack of papers. Once a year, those handouts would remind your parents that picture day was approaching. In the 1960s and 1970s that would mean, on that special day, extra attention would be given to one's grooming. For the girls, it might be tight braids and best dress, knee socks, and patent leather shoes. For guys, it was… well brushing one’s hair, and outfits would vary from favorite superhero t-shirt to starched shirt and tie, sneakers, laces tied: likely not. Of course, by the time pictures were taken, after two recesses on the playground and lunch all that special prep was for waste. And those photographers back then had a knack for catching you just as you were looking in some askew direction, giving future-serial-killer vibes. Ah, those were the days. For some of us, that was the only proof that we were once kids. Pictures are important, and that is why today, I will base this note on pictures. Only three, but interesting ones nonetheless.
Yesterday, we were treated to monthly Retail Sales figures from the Census Bureau. It is always a closely watched release, but in recent months, it has gotten a great deal more attention. Why? Because economists are looking for signs that either inflation or declining sentiment is causing consumers to cut back on consumption. Consumption makes up almost ⅔ of the US GDP, so, naturally, we want to see that remain strong. Now Retail Sales is not exactly consumption as it is defined by the BEA, responsible for tallying GDP, but it is close enough, and I am sure that you would agree that if Retail Sales is shrinking, Consumption is soon to follow. That mostly unimportant disclaimer out of the way, let’s get into it. Retail Sales showed a monthly decline of -0.9%, worse than expected, and last month’s release was revised downward to -0.1%. That is not positive news for the economy. Have a look at picture number 1 and keep reading.
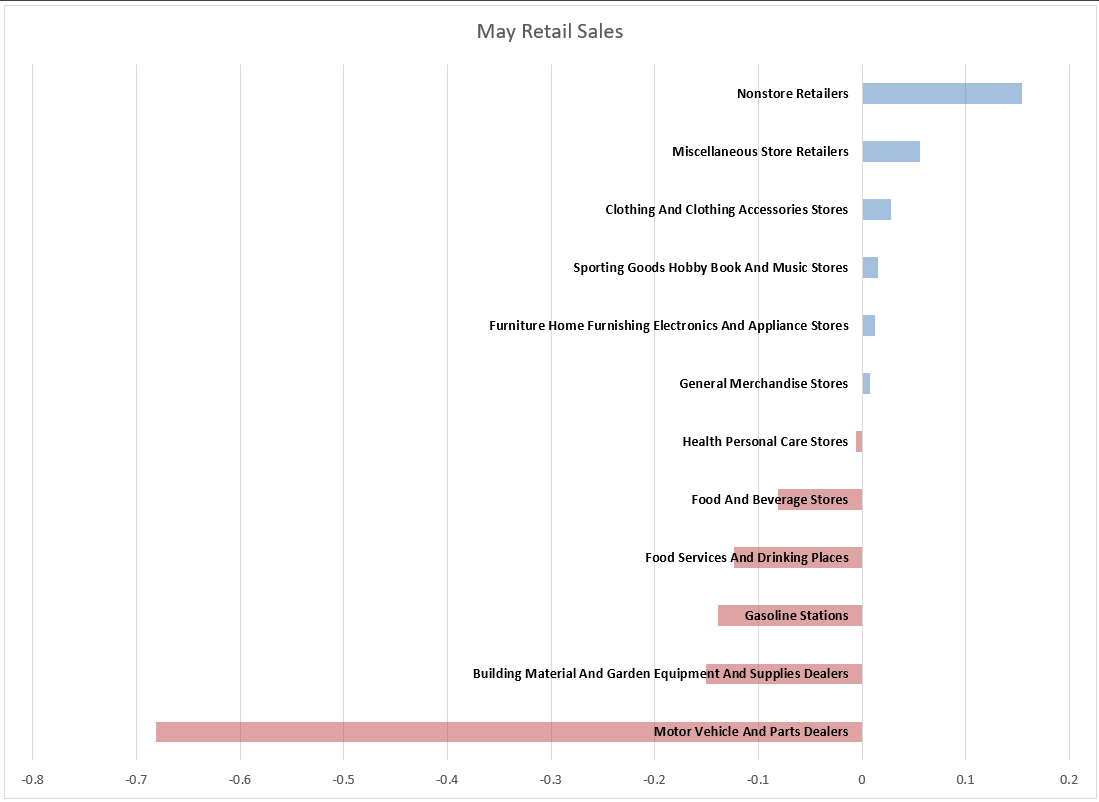
This is a chart of Retail Sales, and it basically shows you everything you need to know, in other words, if you are going to share one chart, this is the one. On it, you should note that Motor Vehicle and Parts Dealers along with Building Materials were the biggest monthly decliners amongst the level 1 aggregates. You may not be surprised that Food and Beverage Stores as well as Food Services declined as well. Nonstore Retailers, AKA Amazon and TikTok, remain the shining star of retail growth for the month. People love their online shopping.
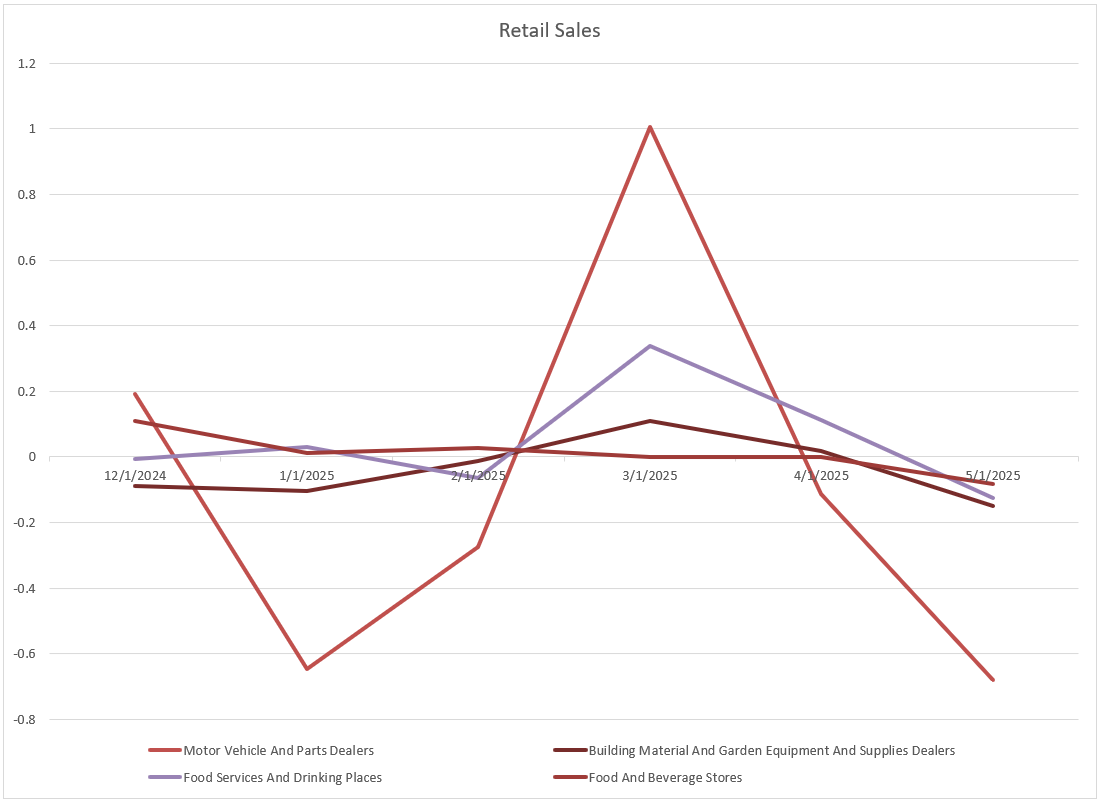
After seeing this, the next question should be whether or not these declines are one-time events, or are they part of a trend? And that brings us to picture number 2. Have a look and keep reading.
On this chart, I chose to highlight only a few of the usual suspects. Namely, cars, building materials, food stores, and food service. Except for cars, if you squint your eyes, you may notice a very slightly negative trend over the past six months… very slightly. On autos, the volatility makes it difficult to derive any defensible trend, however you will note a sharp increase in March followed by a sharp decrease in April and May. In fact, all categories have notably decreased in the past two releases. Though three observations could hardly definitively define a trend, one cannot ignore that this certainly has the hallmarks of the start of something… well, not good.
If, in fact, Retail Sales and Consumption are about to take a turn for the worse, what do you suspect is the cause of that decline? Well, you may recall that consumer sentiment suffered notable declines through April but have since rebounded a bit. Could that initial decline in sentiment have caused consumers to pull back? One sentiment indicator rebounded in May and the other bounced in this month’s early read. So, if the cause of the decline was loss of confidence, then we can expect recent changes to show up in future retail sales figures.
Could anything else have caused the decline in sales? Well, a classically trained economist would point you to prices. Remember, the Demand Curve is downward sloping, meaning demand quantity decreases as prices increase. But you knew that. 🧐 Prices and inflation have been very much on the mind of markets lately. Not because the inflation fighting knighthood Fed will announce its latest policy moves today, but because we are all looking for signs if the administration-led tariff quest is causing prices to rise. That brings us to your final picture, number 3. Check it out then follow me to the close.
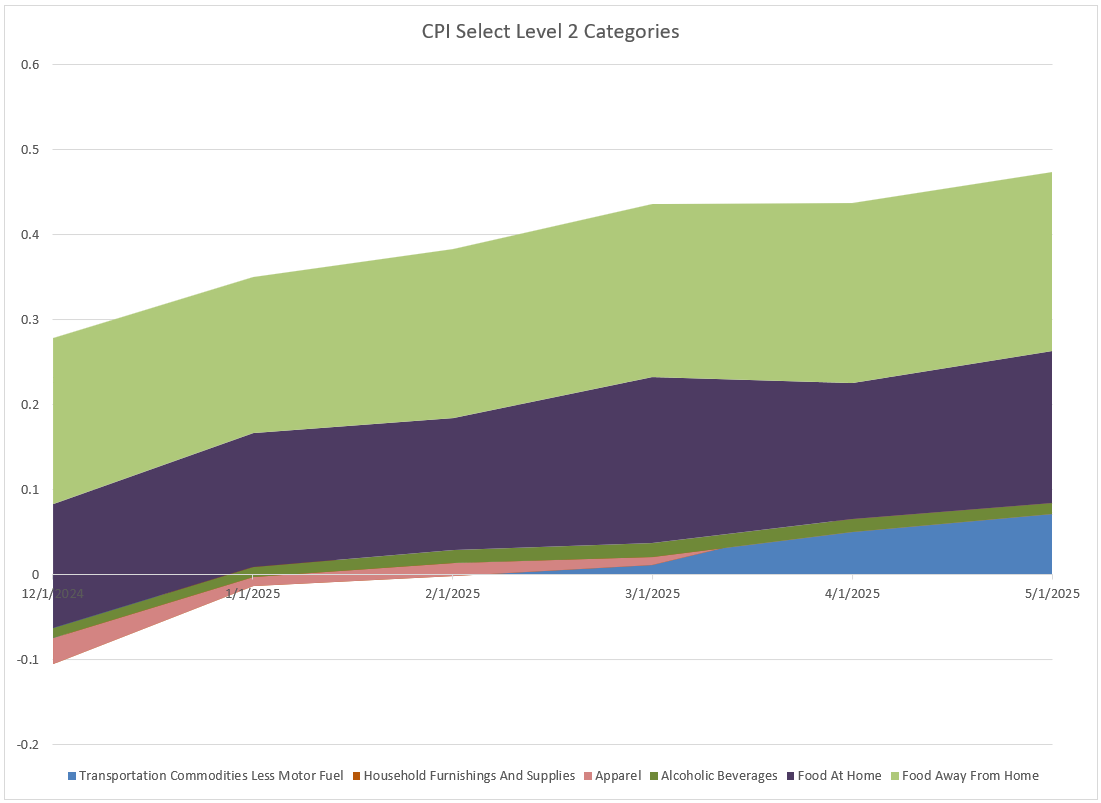
This chart shows Consumer Price Index CPI over the past 6 months. I have selected only a few of the relevant categories to this morning’s discussion. All of these level 2 categories are under Goods Inflation, and you should note that all the aggregates shown have inflation since last December. I want to point your attention to the blue area on the chart. This one depicts Transportation Commodities, AKA automobiles, and it is growing. Meaning prices of cars are going up. I would like to now remind you of the picture number one, above. 🙃 Ah, there it is, the worst performing group in May’s Retail Sales release.
It should be clear that consumers are price sensitive, especially in big-ticket durable goods. We should also note that March’s spike is likely rushed buying ahead of tariffs and auto companies’ announcing tariff-led price increases. So, folks who might have been planning to purchase a new car in April or May, simply purchased the vehicles in March. This would accentuate the decline in that category–which it did.
The important takeaway here is that Retail Sales of certain items appear to be in a declining trend, and indeed, prices of those items have been increasing slowly. Will those increases accelerate in coming months as inventory is sold down? Will consumers continue to pull back? Unfortunately, it is too early to tell definitively, but one cannot argue that there are some signs of possible distress. My mother always opted for the button-down shirt sans necktie. I was never once captured looking directly at the camera and I consistently displayed the contents of my lunch on my neatly pressed, half-untucked shirt. Not pictured: the grass stains on my knees acquired at recess number 2. Pictures are important, so is the context around them.
YESTERDAY’S MARKETS
Stocks declined yesterday in response to a ratcheting up of the President’s rhetoric aimed at Iran. Weaker-than-expected Retails Sales figures were not a welcome sign as trader’s wondered what effect, if any, that they would have on today’s Fed decision.
.png)