.png)

A sugar-high Fed and three trillion-dollar tech giants headline a night that could reshape markets.
KEY TAKEAWAYS
-
The Fed will cut rates but frame it as reluctant due to lingering inflation
-
Meta, Microsoft, and Alphabet will dominate after-hours attention
-
Microsoft’s key metrics are Intelligent Cloud growth, margins, and capex
-
Alphabet’s key metrics are ad revenue, Google Cloud growth, and TAC
-
Meta’s key metrics are ad revenue, user engagement, and capex trajectory
MY HOT TAKES
-
Fed cuts are inevitable–Powell just wants to look cautious
-
Microsoft is the backbone of AI’s monetization engine
-
Alphabet’s future depends on balancing ad cash flow with AI spending
-
Meta’s health is a direct barometer of global consumer confidence 👀
-
AI is no longer hype–it’s an earnings story now
-
You can quote me: “Meta’s ad revenue might be the most honest economic indicator we have right now.”
No rest. The Fed’s FOMC members have been binging on government coffee and lots of sticky pastries as they go through the motions of voting on rate policy. A steady stream of economists has passed through the Eccles Building (Fed HQ) toting thick PowerPoint presentations dense with charts and graphs. Each will share his or her “unique” view of what is happening in the US’s topsy turvy economy which is still kind of reeling from pandemic era sticky inflation, an unprecedented wave of tariffs, a rising tide of layoffs, geopolitical risks, economic drags from a government shutdown, labor market impacts from illegal immigration, and… well, you know, general economics–the kind with all sorts of curves and graphs. Each will culminate in a derivative curve one which a minimum or maximum can be solved for which will show the absolute, perfect interest rate. In reality, they probably could have all met in the lobby for a quick straw poll for “cut or not,” where cuts would carry the day. No matter what their personal opinions, any Fed governor or regional Fed president would find it difficult to deny a rate cut. That said, they will still go through the motions and hold their vote today. They will carefully craft their policy statement to make it look like they are reluctantly cutting rates because inflation is still a problem. Obviously, the big news will come from Chairman Jerome Powell's open mic session that follows the announcement. We will all be listening, but the algos will be acting, pushing markets too and fro on every word and perceived shift in sentiment. One way or another the markets will close with the knowledge that the Fed is in cutting mode.
Once the final ding-ding of the closing bell tolls, the real wave of information will hit. That’s right, a densely packed hour of critical corporate earnings announcements. Dense, maybe, but everyone will really be waiting for just 3. That’s right, Meta, Microsoft, and Alphabet! All the Magnificent 7 are involved in AI in one way or another, but these three are at the tip of the spear. AI, again? You bet. Haven’t you seen the steady stream of articles, posts, and videos on the supposed AI bubble about to pop? Ok, let’s step back. These three stocks are so much more than AI, though AI is a driving force behind much of their growth. Let’s take a quick look at what to expect from these three.
First, let’s start with the money chart. These are all superlative growth companies, which means that their valuations are largely dictated by their ability to grow earnings–consistently and steeply–the more of each the better! Check it out and keep reading.
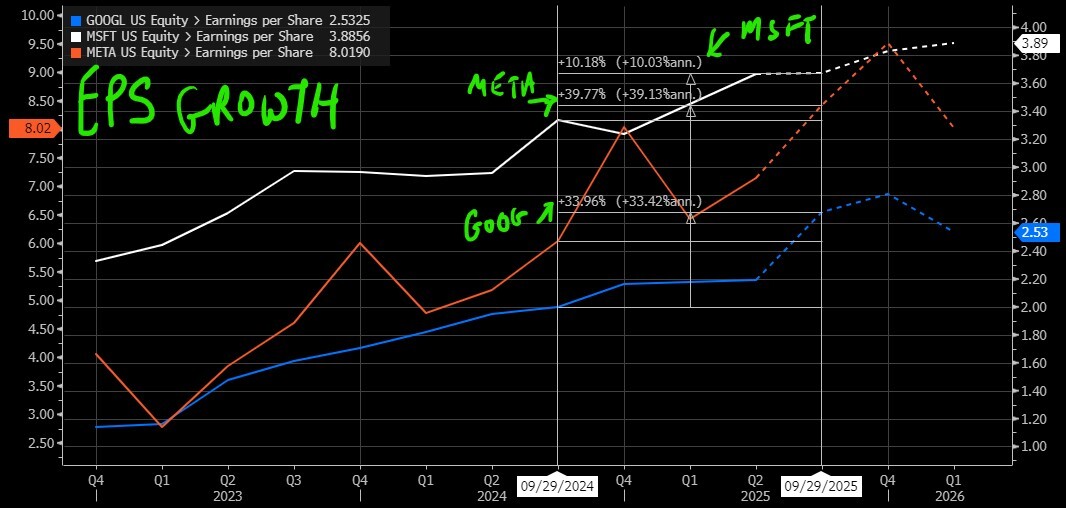
Before we dive into each name, I want you to think about one simple picture. On my Bloomberg GF<GO> charts, I plotted Earnings Per Share (EPS) for Microsoft (white line), Meta (red line), and Alphabet (blue line) over the past three years. EPS is exactly what it sounds like–how much profit per share. For high-growth megacaps, EPS is the scoreboard. You don’t get to have a trillion-plus market cap unless you can show Wall Street that EPS goes up and to the right. 😉 I want you to ignore the exact dollar values on the axes and instead look at how steep each line is, and how smooth that line is, and how that slope changes over time. Then look at the dotted extensions to the right. Those are consensus expectations for this quarter and the next two. That dotted part is where stocks move after hours. That’s where the “we beat” or “we missed” conversation starts. Over roughly the last year, since Q3 of 2024, expected EPS growth for these three monsters is still double-digit. The street is looking for something on the order of ~10% for Microsoft, ~34% for Alphabet, and nearly ~40% for Meta on a year-over-year basis. That is enormous at this scale. So, job one tonight is simple: do they deliver those growth rates, or do they wobble. If you miss at the EPS level, I don’t care how pretty your narrative is about AI or productivity or whatever, the stock likely bleeds. If you beat on EPS, great, confetti cannons go off for about 30 seconds. But then investors go straight into the details I’m about to walk you through, and they will either validate the beat (good) or quietly whisper “one-time accounting noise” (bad). That’s why we’re going under the hood.
Now, I am going to go into each of the three, one by one, covering some of the important metrics to watch, using a similar, high-level analysis and using the Bloomberg GF chart. Go on, push your reading glasses up your nose and pay close attention, so you can be the smartest person on the bus today. Let’s go. Charts will precede the analysis.
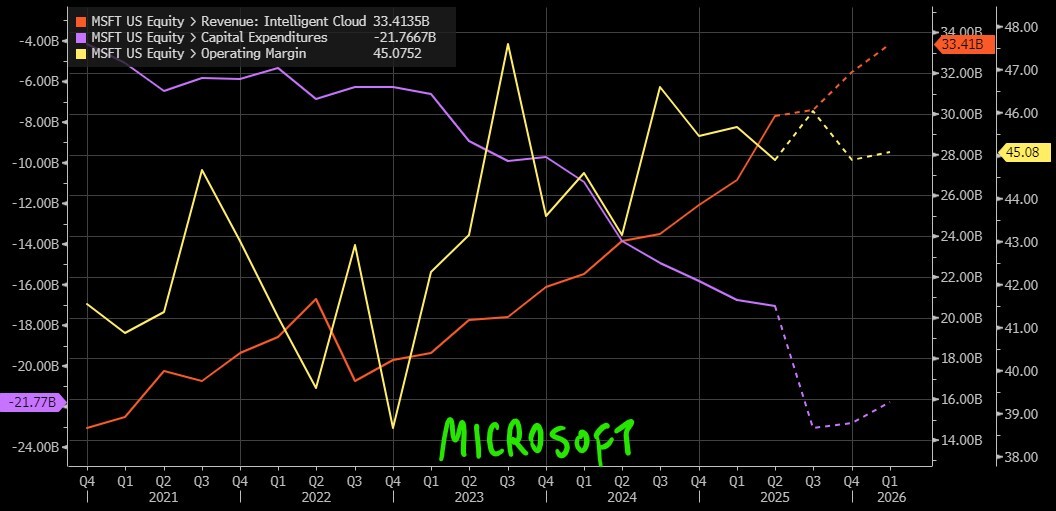
Let’s start with Microsoft. The chart I built for Microsoft tracks three things: Intelligent Cloud revenue (that’s Azure plus enterprise cloud businesses), operating margin, and capital expenditures. Microsoft is, at this point, the purest publicly traded example of “AI infrastructure as a service.” Everyone talks about AI, but Microsoft is literally selling the compute, the stack, the Copilot layer, and the enterprise distribution. Intelligent Cloud is at the heart. So metric number 1 for Microsoft is Intelligent Cloud revenue growth (red line). If Intelligent Cloud is accelerating, it tells you that CIOs are still spending, that Azure is winning workloads, and that AI workloads are actually scaling in the real world, not just in investor slide decks. If Intelligent Cloud growth slows, that’s a tell: either spending fatigue, or pricing pressure, or competitive friction against Amazon and Google Cloud. This is where you’re going to hear talk about “AI consumption,” “GPU availability,” and “workload migration.” Listen carefully to that language. The second Microsoft metric is operating margin (yellow line). Why margin? Because Microsoft has been pouring billions into AI capacity and model integration, and yet investors still want the company to look like a profit machine. If Microsoft can show margin resilience or even expansion while also leaning into the AI buildout, the market basically shrugs and says, “keep spending.” 👊 If margin compresses meaningfully, the market starts asking if we might be witnessing the early stages of a cycle of lower returns, meaning lots of dollars out the door, slower payback. That is how you flip the AI narrative from “genius” to “capital catastrophe.” The third Microsoft metric is capex (purple line), which are the raw dollars going into data centers, GPUs, networking, and infrastructure to feed AI demand. Huge capex is not necessarily bad. In this moment, weirdly, huge capex can actually be interpreted as bullish, because it implies demand visibility. Here’s how to read it: high cloud revenue growth + strong margin + high capex = “we are spending because demand is insane and we’re monetizing it while being mindful about profitability.” High capex + margin squeeze + meh cloud growth = “we are building ahead of demand and praying.” That’s the whole Microsoft setup. Um, the first message is better. 😉
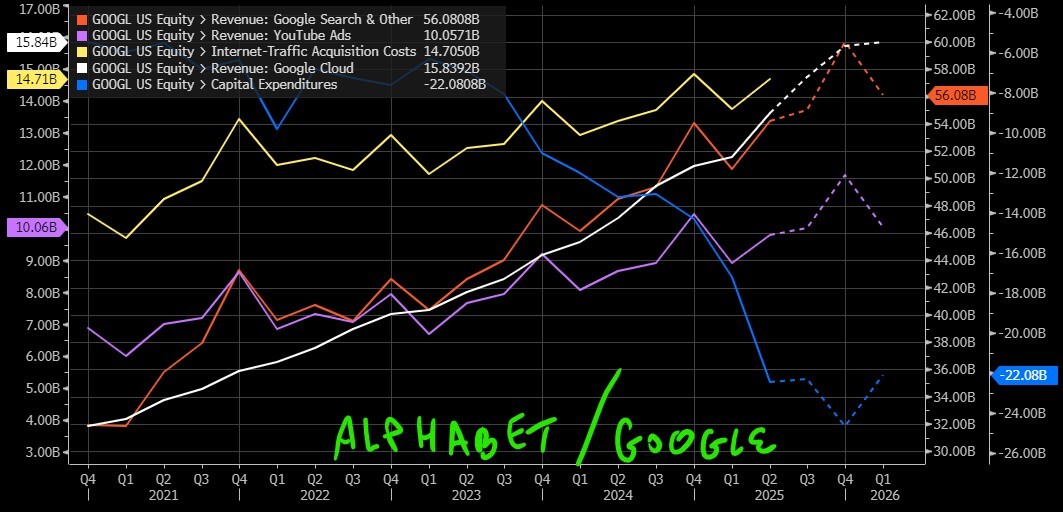
Alphabet next. The Google chart I built follows Search & Other revenue (that’s the core Google Search ad engine), YouTube Ads revenue, Google Cloud revenue, Traffic Acquisition Costs (what Google pays to partners to get traffic), and capital expenditures. Alphabet is two businesses pretending to be one: the ad business that mints cash, and the AI/cloud/infrastructure/“other bets” business that is supposed to define the company’s future. The first Alphabet metric to watch is Search and YouTube ad revenue (red line). This is still the oxygen tank. You will hear a lot of hype about AI assistants, AI Overviews, Gemini, whatever. That’s fine. But if ad growth slows in Search or YouTube, the stock gets slammed because that cash funds everything else! Advertisers pull back when they smell consumer weakness, so Search and YouTube are also a decent macro indicator: they’ll quietly tell you if the consumer is getting tired. 💡The second Alphabet metric is Google Cloud (white line). Cloud is Google’s big credibility play against Microsoft and Amazon. A year or two ago, the story was, “We’re growing fast but losing money.” More recently, the story turned to, “We’re growing AND we’re profitable.” Tonight, you are looking for two things: is Google Cloud still growing fast, and is it making money at a respectable margin. If growth slows or profitability backslides, well, you are likely to hear talk that AI workloads are consolidating… somewhere else, like MSFT. If Cloud is strong and profitable, all of a sudden Alphabet is not just an ad company anymore, and that is multiple-expansion fuel (rich valuation justification). The third Alphabet metric is TAC, traffic acquisition costs (yellow line). TAC is what Alphabet pays to get its search box in front of your face. Think default placement deals, distribution costs, all the plumbing that keeps Google the entry hall of the internet. Rising TAC without a matching rise in ad revenue is a margin killer. Stable or falling TAC while ad revenue is strong is the dream. Watch that spread. Also keep an eye on capex the same way we did for Microsoft. Alphabet has to spend to compete in AI, to build data center capacity, and to run ever-bigger models. If capex is exploding higher, they need to convince you that this future AI assistant world is actually monetizable, not just some fad or fantasy. You’ll notice in the chart that capex (blue line) has been ramping into 2025 (ramping up means trending downward because, in accounting, it is a negative number 😉), right alongside Cloud and ads. That alignment matters. It tells you if they’re spending from strength or spending out of fear of being left behind.
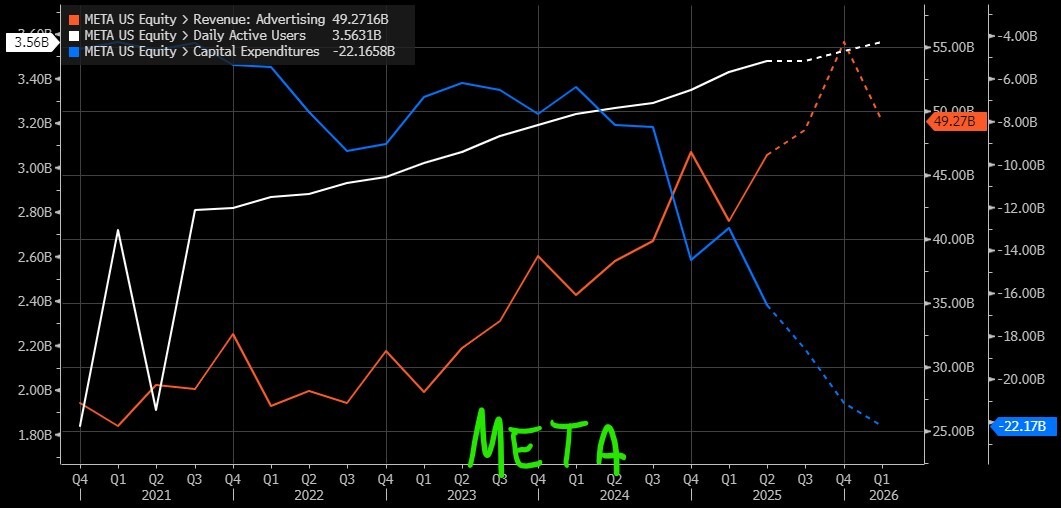
Finally, Meta. People still intuitively think “Facebook,” like this is a single-app social media story. That’s cute, but far from reality. The Meta chart tracks three big pillars: advertising revenue, daily active users (their “family” of apps engagement footprint), and capital expenditures. Let’s decode those. The first Meta metric is ad revenue (red line). Meta is still, at its core, the most effective targeted advertising engine on earth! When they say, “advertising revenue,” that is the market’s real-time read on commerce sentiment, small business marketing budgets, and the health of the consumer. Read that again–it’s kind of a big deal. If ad revenue growth rolls over, that is a red flag not just for Meta but for every consumer-facing stock in the S&P. If it keeps charging higher, that tells you businesses are still spending to chase you around Instagram and Reels. 😁 The second Meta metric is engagement through daily active users (white line). You will sometimes hear it framed as “Family Daily Active People,” which is Meta-speak for “unique humans touched by Facebook, Instagram, WhatsApp, Messenger.” I am certainly one of those humans touched by those, lol. This is the gasoline that feeds the ad machine. You can’t sell impressions if you don’t have eyeballs. Investors have been watching for any plateauing in user activity, especially in North America and Europe. A flat or declining engagement trend tells you that Meta is having to work harder (and spend more) to squeeze the same dollars out of a slowly maturing audience. Strong engagement lets them raise ad load and pricing without ruining the experience. The third Meta metric is capex (blue). Yeah, that again–can you tell that it’s important? Meta’s capex is doing two jobs at once. Job one: build AI capacity for recommendations, ranking, personalization, ad targeting, safety, and new products like generative ad creation. Job two: keep funding the long-game bet on mixed reality / metaverse hardware, which Wall Street, myself included, still kind of hates but can’t fully ignore because if it ever works, the payoff can be huge. You’ll notice in the chart that Meta’s forecasted capex shoots higher into late 2025 and then edges down. That “spend peak then ease” shape is exactly what investors will grill them on tonight (it’s not too obvious in the chart, but it's important to understand the nuance). Are we past the heaviest build period or are we just pausing before another giant leg up in spend. If Meta tries to guide capex way higher again without pairing it to obvious revenue upside, the stock gets punished. If they can argue “we’ll keep spending, but it’s translating directly into incremental ad dollars per user,” then investors nod and move on.
To sum up–I know it was fast and furious, here is how to think about all of this in one breath. Microsoft is a hyperscale infrastructure and software monetization story–the bet is that AI isn’t just hype, it’s billable enterprise consumption running on Azure, with fat margins. Alphabet is an ads-plus-cloud transition story–the bet is that they can defend its golden goose (Search/YouTube ads) while simultaneously proving that Google Cloud is real grownup profit, not a science project, and that they can afford to spend billions on AI chips and data centers without trashing margins. Meta is an engagement-plus-ad-yield story–the bet is that Reels, Instagram, WhatsApp, etc., are still absolute attention super-conducting-magnets, and that Meta can keep dialing up monetization per user while also dropping boat loads of cash on AI hardware and future platforms. Now, breathe.
One last point before you run around pretending you’re a rockstar analyst. 🧑🎤 None of this is exhaustive. We’re not even touching stock buybacks, headcount, regulatory risk, political pressure on social platforms, antitrust noise, AI safety costs, or the small matter of whether governments are going to start taxing the living daylights out of these companies to close fiscal gaps. All of that matters, and all of that will get airtime on the calls. But if you watch just these core levers: Microsoft’s Intelligent Cloud vs. margin vs. capex, Alphabet’s ads vs. Cloud vs. TAC, and Meta’s ads vs. engagement vs. capex, you’ll be able to understand 80% of the market’s initial reaction. You’ll know whether the AI buildout is still paying for itself. You’ll know whether the consumer is still spending. You’ll know whether these companies are buying the future or mortgaging it. And when everyone else is doomscrolling “AI bubble” headlines, you’ll already know whether the numbers underneath can still carry the story. Grab a relaxing tea and some cookies for the Fed presser, but make sure you are comfortably nestled in your seat for the after-closing-bell announcement, because that is where the real ride starts.
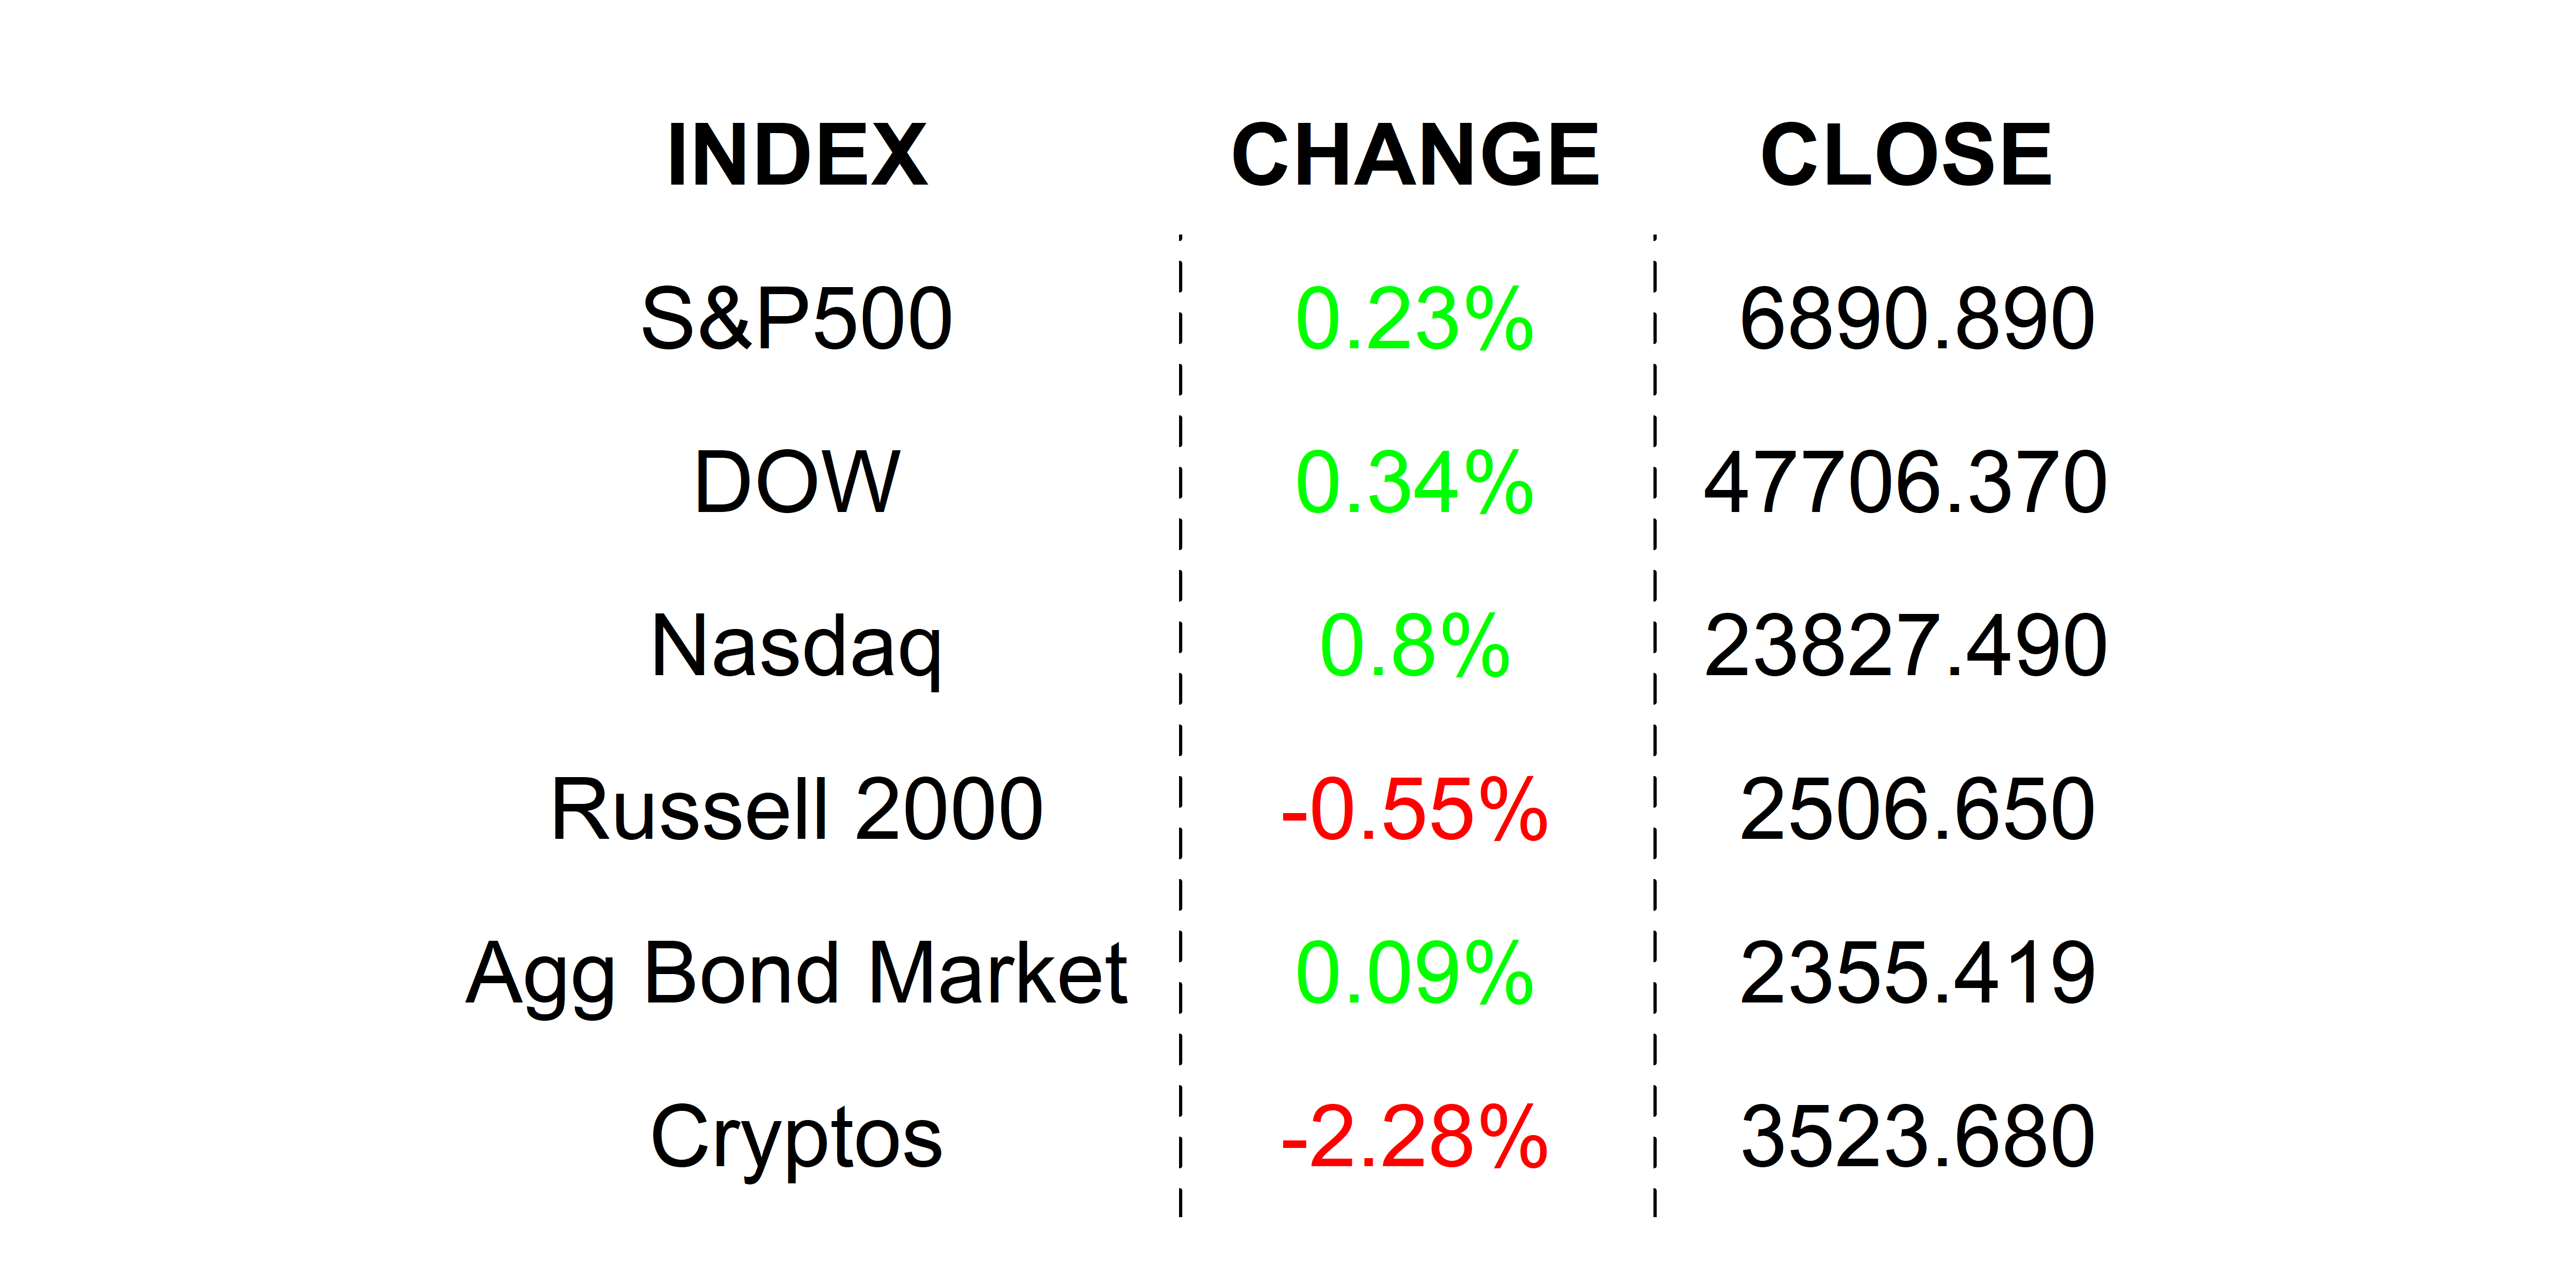
YESTERDAY’S MARKETS
Stocks stuck the landing last night, jumping on news that things with China might end up OK, after all. Earnings remain solid but investors are on seat's edge for tonight’s Mag-7 fireworks. Pressure continues on yields as Fed policy takes center stage today.
NEXT UP
-
Pending Home Sales (September) are expected to have advanced by 1.2% after climbing by 4.0% in August
-
The Fed will announce its policy decision at 2:00 PM Wall Street Time. Chairman Powell’s presser will follow at 2:30. Don’t miss this–obvi
-
Important earnings today: Flex, Generac Holdings, CVS, Phillips 66, Kraft Heinz, Boeing, GE HealthCare, Etsy, Entergy, Otis Worldwide, Verizon, Caterpillar, American Electric Power, Align Technology, Chipotle, MGM Resorts, Microsoft, Meta, Alphabet, eBay, ServiceNow, and Boot Barn.