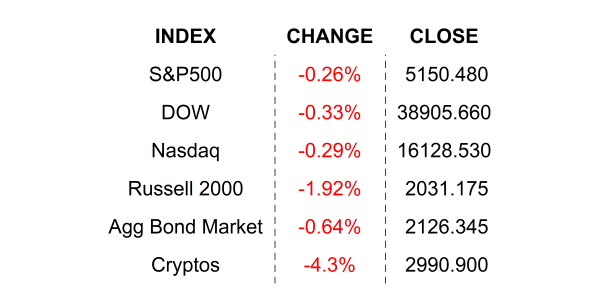
Stocks declined yesterday after Producer Prices came in a bit hot – too hot for comfort. Retail Sales numbers missed their mark offsetting the troubling inflation news, but traders were not comforted.
Can’t get you outta my head. First off, I am sorry that I missed you yesterday. My longtime regulars know that it is a rare occasion for me to miss a daily note, but yesterday’s travel plans from LA to NY simply prevented it. That said, I am back, and this wicked cough and sore throat which I picked up enroute will not stop me from this morning’s chat. Second, I probably would have written about inflation and somehow tied it into yesterday’s being Pie Day (3.14 for you non-nerds). So, let’s just say I gave you a day off from inflation and the Fed, and now that you got your respite in, I feel like it is OK to discuss… um, inflation and the Fed.
Yesterday, WHILE YOU ATE TOO MUCH PIE, and I tried to get work done on my packed-with-sick-folks flight, the Bureau of Labor Statistics (BLS) released its Producer Price Index / PPI, and the monthly number came in twice the expected amount at +0.6%. That bump caused the year-over-year number to come in at a hotter-than-expected +1.6%. Why all the hyphens? Well, other than my obvious love for them, those numbers are indeed noteworthy, and not just because of their being greater than expect… or is it greater-than-expected. No, it is because PPI is considered to be a leading indicator of consumer inflation. PPI measure costs to producers and retailers, as in the costs that the folks who sell US stuff pay. The theory goes that rational companies will pass on their cost increases to the consumers, and in case you haven’t noticed, companies have been quite rational recently… maybe even to the point of profiting our good nature. Let’s take a quick look at what drove the increase that caused 10-year Treasury Note yields to jump by +10 basis points and caused growth stocks to falter.
To start, let’s look at the yearly figures. From a year ago, Construction and Energy prices have disinflated (that means that price growth has slowed), while Goods and Services have inflated (that means price growth has increased). Of the two inflating culprits, I am sure that you are not at all surprised to hear that Services is the real troublemaker, gaining by +1.547%. The source of the Services increase is Services Less Trade, Less Trade Transportation and Warehousing. I know that aggregate is not very detailed, despite its name, but at least we know that the bump was not from transportation and warehousing which was indeed a pain maker early in the recent inflation bump. So, really, nothing new on the yearly front, and before you lose your marbles, check out this chart and then follow me to the finish.

That’s correct, the average PPI since 2010 is +2.6%, which means yesterday’s print was below average (basic math). Feel better now? No, OK, let’s look at the monthly numbers. The overall monthly gain was +0.6% and the largest gain was Energy followed by Services. If you look back through history, those two have a history of monthly volatility. Looking at any emerging trends, we can only see that Service had 2 consecutive months of gains. Though 2 months can hardly be considered a trend, it is worth watching, considering the services, propelled by the tight labor market, has been the stone in our shoe these past 12 months as inflation has been receding.
Knowing this, you may wonder if the Fed is concerned about yesterday’s print. While the number is noteworthy, it is not likely to cause any changes in policy path, and we will find out next week when the FOMC meets and delivers its quarterly forecast. Economists are of the general consensus that policy makers will tweak up their economic growth forecast a bit but keep rate projections unchanged. That means 3 cuts of -25 basis points before we ring in 2025. On this, the futures markets finally agree. Stay tuned and stay frosty.
WHAT’S HOT THIS MORNING
Intuitive Surgical Inc (ISRG) shares are up by +4.11% after the FDA issued a 501(k) clearance for the companies next generation robotic surgical system. The companies forward PE of 62.11x is higher than the 37.38x median PE of its peers. The company will announce earning next month. Potential average analyst target upside: +4.9%.
Jabil Inc (JBL) shares are lower by -10.64% in the premarket after it announced that it beat EPS estimates. The company lowered full-year guidance that was below median analyst estimates. 90% of analysts that cover the stock rate it a buy with the balance rating it a HOLD. Dividend yield: 0.21%. Potential average analyst target upside: +2.6%.
Small cap volume spike: Fisker Inc (FSR) is higher by +33.63% after the troubled automaker disclosed that it is in talks with a “big” un-disclosed automaker.
YESTERDAY’S MARKETS

NEXT UP
- Industrial Production (Feb) is expected to come in flat after slipping by -0.1% in the prior period.
- University of Michigan Sentiment (March) may have inched higher to 77.1 from 76.9.
- Next week: housing numbers, flash PMIs, Leading Economic Index, and FOMC meeting. Check in on Monday for calendars and details.
Have a great weekend, Sláinte 🍀, and please call if you have any questions.
.png)

