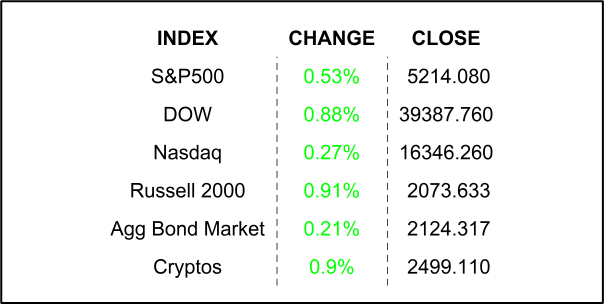
Stocks rallied yesterday, helped by earnings and a weaker-than -expected weekly jobs number. Confusing as it may sound, bad news for the economy empowered the bulls in yesterday’s market gain.
Technically speaking. Trying to predict the stock market in the near term is folly. Go on, read it again. Got it? My regular readers have seen that term grace this note many times. Now, understanding why the stock market behaved in a certain way in days past is a much more rewarding endeavor. Looking at the market’s past performance at a high level, one can see a historical account of human emotion strewn about like laundry, freshly washed, hung to dry, but blown off the clothesline onto the dirty ground by shifting gusts of wind. Does that image cause you a bit of anxiety? Sure, it does, even if you’ve never hung wet clothes on an outdoor clothesline… and probably the reason you never have. But do please entertain my notion and get back to the picture I painted.
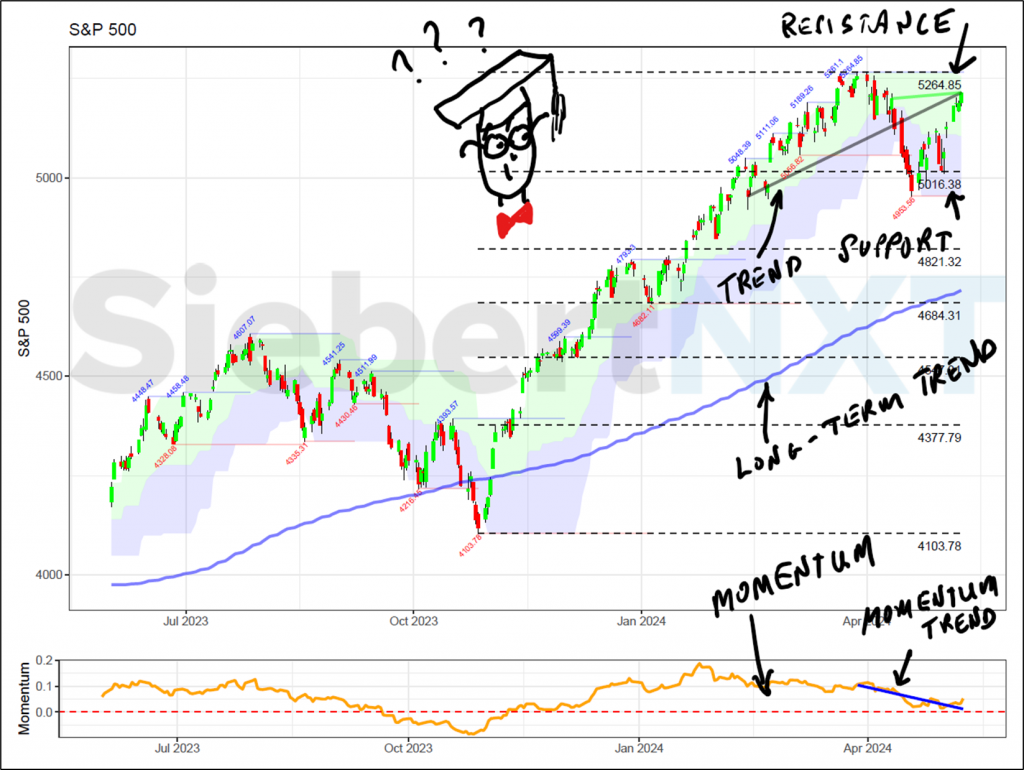
Imagine, once your anxiety dies down, that you look more closely at the clothes strewn about and you see some sort of pattern. You may notice that all the clothes are on the ground between your old maple tree and your patio, with certain items closer to your patio than others. You recall that this exact pattern occurred several times in the past. You think about it and realize that the maple tree and patio are south of your clothesline. Well then, logically it was a north wind that caused the misfortune. BUT you love the north wind because it always brings with it a fresh, cool texture leaving the clothes dried just like you prefer. So, what are you supposed to do? You can’t just wear damp clothes every time the wind blows from the north. You are not going to give up. You check the moon cycle and see no pattern. You consult your Farmer’s Almanac. Nope. How about the dog, has she been acting differently? Sorry, no, she still prefers to eat garbage out of the bin, as always. Wait, you check the local weather and read below the first two lines about the sun and the temperature, and you get to the part which says, “winds from the north with gusts up to 20 miles per hour.” Aha, we may be onto something. Now you break out your calendar and try to remember the last time this occurred. You Google your local weather history and sure enough, winds were from the north with strong gusts the last time this occurred. Intrigued, you go back even further and find that, sure enough, it was the gusty north wind once again. Now you formulate a strategy. Between your second cup of lukewarm coffee and throwing in a load of laundry, you are going to check the weather. If the wind is from the north and gusts are less than 20 mph, you carry on. If gusts are greater than 20 miles per hour, you put the laundry off for a day and find a more productive use of your time. Here is a chart of the S&P500 from my daily chartbook. I handcraft it daily for you… daily, as its name implies, so I hope you consult it occasionally… if not daily 😉.

Can you see the laundry strewn about this chart? No? Well, I have given you some clues. You can see that the long-term trend is positive by the direction of the blue line (200-day simple moving average) and the fact that the market is trading above it. The black and green lines tell us that the mid-term trend is also positive but the shorter-term trend, while also positive, is weaker. This means that the “positivity” is diminishing. We can see the strength of the trend by looking at momentum in the bottom panel, where the orange line is above 0. We can also see by the blue line (which is the linear regression of the momentum) that momentum is fading. For you math geeks, that orange line is the derivative of the market, and the blue line is kind of the second order derivative of the market’s motion. Ok, so it is positive but possibly losing some steam, but where is it headed? It looks like at least 5264, which is where it tried and failed for whatever reason in the past. Look at how the market bumped up against an imaginary line there in late March. No guarantees of course, but what if it fails to break through again and there is a selloff? How low can it go? Well, based on this laundry pattern, we can see that in the past there has been support around 5016, first back in mid-April, and also further back in February. If you had the gumption, you might draw in a 100-day moving average (not pictured) and see that the market bounced off of it in April corroborating the support line on this chart. Look farther back. Can you see some similar patterns?
You use your newfound laundry strategy, and you feel rather accomplished because it works for quite some time… until it doesn’t. Confused, you press your specs up against your face and have a closer look. You notice that your laundry is strewn about to the north of the clothesline. You wonder how this can be as the forecast called for mild northerly winds. You lick your finger and hold it up and confirm that there is indeed a mild breeze from the north. You are confused and disappointed. As you apply yourself to collecting your now-dirty laundry a, sudden, stiff gust hits you from the south only to relent to the prevailing light, northerly breeze. You wonder if it was all worth it and you realize that the system is not perfect, but you had managed to effectively minimize the problem, having only to re-wash once in the last 6 months versus the many time that occurred in the 6 months prior. Don’t ignore the charts. They may be imperfect, but being right every time is not what we seek, we just want to be right most of the time.
YESTERDAY’S MARKETS

NEXT UP
- University of Michigan Sentiment (May) may have slipped to 76.2 from 77.2.
- Fed speakers today: Bowman, Logan, Kashkari, Goolsbee, and Barr.
- Next week: Still more earnings, but also Producer Price Index / PPI, Consumer Price Index / CPI, Retail Sales, housing numbers, and Leading Economic Index. Check in on Monday to download economic and earnings calendars… AND my daily chartbook… unless you want to find your clean laundry in the dirt.
.png)

