Stocks tumbled further yesterday in response to a less-than-stellar earnings release by Salesforce. First quarter GDP growth was revised downward reflecting consumers’ pullback from Q4 of last year.
What goes up… How is that for a trite tagline. In fact, I have probably used that one before… maybe even more than once. That is most likely due to the fact that every now and then I feel responsible to explain to you, my loyal readers, how volatility works. First let’s start with the opening line of every finance professor from undergraduate to graduate to doctoral programs: THERE IS NO SUCH THING AS A FREE LUNCH! Let me put it more directly. You didn’t earn +101.72% on your Tesla stock position last year for free. I mean, it took guts to stay in the stock after it lost -65% the year before. It could have continued to go down last year, but you decided to take the risk and hold… and you were rewarded handsomely. Did you decide to take the risk and let it ride into this year thinking it was going to be another 2020 where the stock earned +743% (not a typo)? Well, it may be another 2020, but so far with stock down -28% year to date, we are certainly not off to a good start. That -28%, my friends, is the cost for the potential to have another possible +101% year like last.
It goes back to the old risk / return continuum you probably learned about from your peewee league baseball coach as a wee child. You can’t get a hit unless you take a risk and swing at the ball. You can’t get a homerun if you don’t swing hard. If you swing hard, you have a greater chance of missing the ball, but if you swing softly you only have a chance of getting to first base. I can keep going, but I am sure you got the picture.
Let’s look at the broader stock market, say, an index like the S&P500. The S&P itself has proven to be a very solid investment. If you invested in the S&P with an ETF last year, you would have earned +24%. Friends, THAT IS AN AWSOME RETURN, even though something in your mind may tell you otherwise. BUT, similar to our Tesla story above, that too comes at a risk. Earlier this week I wrote about complacency and mentioned the VIX Index. I even recorded a few videos on it, which someday soon I hope to share with you DAILY so you can become loyal VIEWERS as well 😉. The VIX Index, based on S&P500 options, shows how investors think the S&P500 may fluctuate over the next 30 days. We can do some fancy math using the VIX to come up with expected daily moves by the market. My piece from earlier in the week was about complacency and how low the VIX was given all the mounting macro risks. As you might imagine, if you have been following the markets this week, the VIX has moved higher since I wrote AND RECORDED that submission and is now at 14, which is around the average over the past 12 months but significantly lower than the 12 months prior which was in the 20s. So, the fancy math says that with a VIX of 14, the market expects daily moves of 0.88%. We can use the same math to calculate monthly moves which are 4.04%.
Now we finally get to the point. We now know what the market expectations are for fluctuations in the S&P500. Here, is the thing. Fluctuations work in both directions! So, that means we can either gain +4% over the next 30 days or lose -4% in the next 30 days. Does that seem risky to you? It is only the cost of the potential to earn another +24% this year. Let’s put a fine point on that. What are you willing to pay in order to own a stock that can earn +238% in a year? Is a -3.77% loss in one day worth it? Those numbers are from NVIDIA, and whether it is worth it or not is purely up to you. Is it time for lunch yet?
WHAT’S FLUCTUATING IN THE PREMARKET
Ulta Beauty Inc (ULTA) shares are higher by +7.89% in the premarket after the company announced that it beat EPS and Revenue estimates. The company actually lowered its full-year guidance below analysts’ expectations, but analysts expect that the new target is more achievable. Famous economist John Maynard Keynes once said, “The market can stay irrational longer than you can stay solvent.” Go figure. Potential average analyst target upside: +26.8%.
NetApp Inc (NTAP) shares are higher by +1.72% after the company announced that it beat EPS and Revenue estimates. The company provided full year guidance that was above analysts’ expectations. The announcement drew an upgrade to NEUTRAL from JP Morgan which also raised its price target for the company. Dividend yield: 1.78%. Potential average analyst target upside: +1.1%.
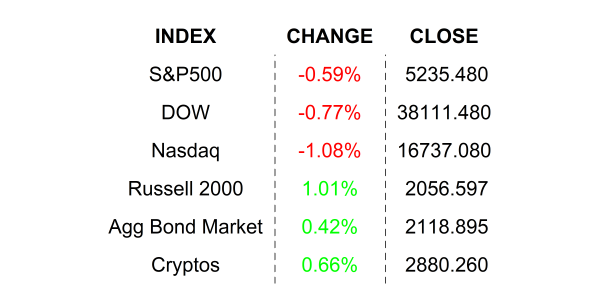
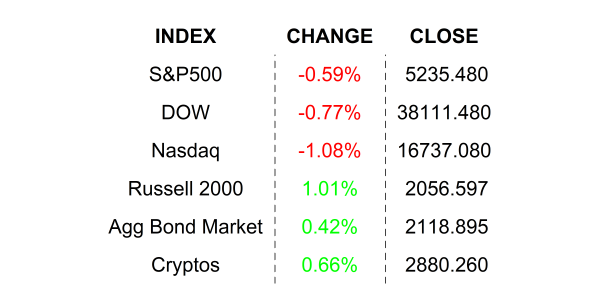
YESTERDAY’S MARKETS

NEXT UP
- Personal Income (April) is expected to have grown by +0.3%, lower than the prior period’s +0.5% gain.
- Personal Spending (April) may have slowed to +0.3% from +0.8%. The Fed would like this.
- PCE Deflator (April) is expected to have remained at +2.7% with monthly change in the core expected to have slowed to +0.2% from +0.3%.
- Next week: still some more earnings along with PMIs, JOLTS Job Openings, Factory Orders, Durable Goods Orders, and monthly employment report. Check in on Monday for calendars and details. And stay tuned for the videos, they are coming soon.
.png)

