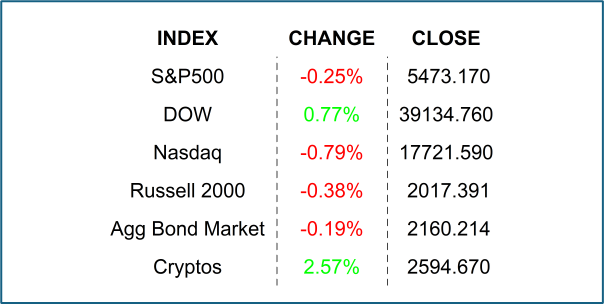
Stocks had a varied close yesterday the Dow skipping and the Nasdaq tripping on mixed global economic data. Housing data suggests a cooling of the hot real estate market, but historical volatility suggests it may not be long-lasting.
Analysis paralysis. It has been a busy year for bureaucratic bankers. Come to think of it, it has been a busy couple of years for them. Going back to late 2018 when the stock markets threw a literal temper tantrum with the Fed raising interest rates in an environment where corporate earnings growth developed anemia and the US economic expansion was getting long in the tooth, the Fed had its work cut out for it. It was clear that something had to be done… to prevent the stock market from melting away consumer confidence and causing an outright recession. But there was no sign of economic recession. So, the bankers’ challenge was how to increase confidence in an expansionary period. After all, rate cuts are thought of as an “emergency” tool to be broken out only when recession is imminent. Chairman Powell found the answer by suggesting that easing might be “appropriate.” The implied policy shift saved the market. It took another 6 months or so for the Fed to invent the right words to actually make a policy shift with rate cuts. Those words “mid-cycle adjustment” were the first of their kind, but they did the trick, and the Fed got its pass.
Before the brainy, zany bankers had a chance to organize a pizza party to celebrate the win, the nation was zonked with the COVID pandemic. There were no economic numbers to suggest it yet, but the stock market sent its vote in, and it was clear that action would be required to prevent a full meltdown. Now, I am a quant, which implies that I have created my share of massive spreadsheets, run days-long simulations, and created millions of lines of R, Python, and C code over these past 35 years. I can tell you, that there is a time for analysis, and there is a time for action. In early 2020, it was clear that it was time for action for the Fed. And act it did, opening up all the spigots of aid, even discovering new ones. I would argue that the Fed’s actions almost single-handedly kept the sinking ship of the US economy afloat with its quick response. After that there was no time to celebrate victory. No, it was time to build models to explain what they did and what might be the central bank’s next move. It had time to think… almost 1 year before inflation began to become apparent. What, inflation? None of the bankers had ever even seen an inflation figure north of +3%, so when it started to pop up in mid-2021, they were caught a bit off-guard. Was it time for analysis? The bankers analyzed, and with analysis not even complete yet, the bankers’ hands were forced, and they decided that it may be “appropriate” to act, as it was clear that inflation was not “transitory.” A few small raises in the beginning of the following year did nothing to stop inflation from gaining more ground. The answer to that problem was to tear a page out of the Volcker / Greenspan era playbooks. Apply shock and awe-like monetary tightening. IT WORKED!
But there was no time for celebration. No, it was time to analyze and build models to figure out when and how to reverse the massive tightening maneuver. Those models are growing larger and larger every day. Trust me, I know a thing or two about economic models 😉🤓. What do you think those models are telling the Fed policymakers? You don’t have to answer the question, it was rhetorical. When inflation peaked in mid-2022, food was inflating at +1.5%, goods at +1.5%, energy at almost +3%, and services at +3.1%. As of this last CPI reading, food inflation was at +0.28%, goods DEFLATED at -0.38%, energy was at +0.26%, but services remained at +3.1%. So, it is clear, all models withstanding, that services remains a problem. Looking more closely at that, it is rent and motor vehicle insurance that contribute most to the overall figure. Is it possible that these inflationary forces on just 2 sub-categories are simply not responding to higher interest rates? 😕
Last night, Minesota Fed President and frequent expounder of opinions, Neel Kashkari told a group of economists that the Fed’s Dotplot is problematic. Why? Because modeling the economy is hard to do. Thanks Neel. Models are made to take the guesswork out of decision making, but it’s anyone’s guess where interest rates and the economy will be at the end of the year. In other words, those dots are just best guesses. Oh boy, is your head spinning yet? My regular readers know that I have often written (and I even recorded a video about it) that the dots are interesting but are useful only in the minutes after their publication, because they likely change with the next day’s economic news, though the changes won’t be reflected until 3 months later. The Fed Chairman himself has told us to take the dots “with a grain of salt.” Perhaps, it is time to put down the models and consider what they, THE MOST POWERFUL BANKERS IN THE WORLD, might do to help slow rising rents and auto insurance. Of course, the answer is not clear, so they may have to be creative… and maybe even… proactive. There will be plenty of time to create models later.
YESTERDAY’S MARKETS

NEXT UP
- S&P Global Flash US Manufacturing PMI (June) may have slowed to 51.0 from 51.3.
- S&P Global Flash US Services PMI (June) may have slowed to 54.0 from 54.8.
- Leading Economic Index (May) is expected to have declined by -0.3% after falling by -0.6% in April.
- Existing Home Sales (May) probably fell by -1.0% after pulling back by -1.9% in the prior period.
- Next week we will get more housing numbers, Consumer Confidence, regional Fed reports, GDP, Personal Income, Personal Spending, Durable Goods Orders, and PCE Deflator. Check back in on Monday for calendars and details.
- Don’t forget to check out my attached daily chartbook. Those charts are chock full of indicators to inform your next trade.
.png)

