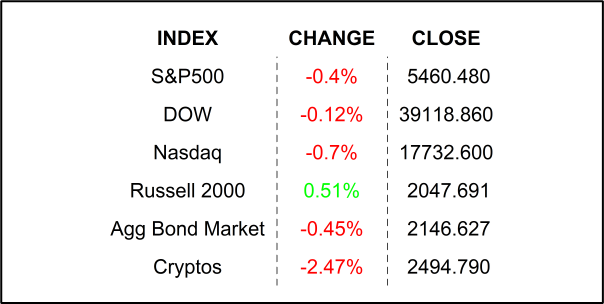
Stocks fizzled out in the final hours of the quarter on Friday as the bulls hurried to the beaches trying to forget a week of zany occurrences. The Fed’s favorite gauge of inflation showed that price growth cooled a bit raising the probability of rates cuts.
The third rail. You would like to know what my thoughts are regarding last week’s presidential debate. I know this because many of you have asked me. My long-time readers know that I try very, VERY hard to focus on “policy, NOT politics.” Policy is extremely important when it comes to the economy, the capital markets, your portfolio, and yes, even your personal safety. While your personal safety is important to me, I, for obvious reasons, focus on the former three and the policies that affect those. Disclaimer is now out of the way, so let’s get to it, shall we?
The debate happened, and whatever happened at that debate… happened to be broadcast to millions of households. Oh, and compliments of the internet, millions of memes were generated in the days that followed to remind us of the… um, highlights of the night. Regardless of what I thought, what is important was what the bulk of voters thought as they watched the two candidates spar. Did it ultimately affect what voters may do at the polls in November? THAT is what YOU want to know. Well, I have prepared the following chart to give you an idea. Take a look and keep reading, friends.

Did you stare at that chart for a long time? Of course, you did, it is a lot to take in. This shows clearly that Biden’s and Trump’s election win probabilities were almost neck to neck since late last year. AND how that they drastically changed after last week’s debate, leaving Trump with a 57% chance of winning in November and Biden with only a 30% chance. These numbers come from the website Predictit.com and I was able to plot the history with magic provided by my trusty Bloomberg. Now these numbers are derived from everyday folks placing bets on the outcome. That means, if there is enough volume, we can get an idea of public sentiment. It works similar to the stock market, in many ways. Obviously, there are so many factors that can affect the accuracy of these predictions, the least of which is that we have no idea who is “trading” these shares. Of course, they are subject to manipulation, though nobody likes to lose money, so maybe there is a hint of accuracy in this chart. I simply found it interesting that we could track the candidates on a daily basis based on some motivated individuals willing to put their money where their mouths are. As with the stock markets, these things are obviously subject to change… almost every minute, and one can see by the history that the numbers can swing fast and hard… in either direction.
Now, let’s take a step back and look at a more traditional method for prediction, polling. Realclearpolling.com tracks all the major polls to come up with favorability metrics. Also, through the magic of my Bloomberg, I will share the following chart which tracks the favorability ratings of both candidates. Take a quick look and follow me to the finish.

On this chart, it becomes clear that, except for a wide divergence in late 2022 into 2023, the candidates’ favorability was pretty much in lockstep since late ’21. It is clear, that even prior to last week’s debate, Trump’s favorability ratings were rising more quickly than Bidens. Trump’s trend has been positive after bottoming out in late 2022, while Biden’s trend has been negative over the same period. Now, this data does not reflect last week’s debate as most of the constituent polls were conducted prior. You can see by the chart’s history that these ratings can swing hard and fast as well.
So, we are around 5 months away from the election, and if I showed you just these 2 charts in a vacuum, you would likely predict Trump as the winner… based on all the data we have today. Now, getting back to the important question. Have we learned anything about policy that might affect the economy, the markets, or our portfolio if, indeed, Trump wins? Well, it would seem to me that so far, the only high-level policy talking points of both candidates involve increased spending. While the recipients of those are likely to rate their candidates more favorably, the rest of us may, unfortunately, be stuck with… um, more potential inflation and slower economic growth… essentially, not good 😉. There is still plenty of time for both candidates to get into policy in the weeks and months ahead, at which point we will most likely be in a better position to PREDICT, not so much the election results, as much as how whatever happens on that November Tuesday will affect our wealth. Until then we can only simply… speculate. Speaking of speculation, I wondered, after that important back-and-forth from the other night’s debate regarding both candidates’ golf prowess, who would actually win in a golf matchup. Wouldn’t you know it, there is a betting line on that! According to the website BetOnline Trump, the odds of a Trump win are 1/33. That basically means that Trump is heavily favored – if you bet on Trump, you would get a very low payout according to these odds.
Be patient folks, I am sure that we will soon have some real policy to ponder. At that point we can, and we will address the impact of those policies. With those, you can make an informed choice. Until then you will have to try very hard to filter out the noisy politics.
FRIDAY’S MARKETS

NEXT UP
- Construction Spending (May) is expected to have climbed by +0.2% after slipping by -0.1% in the prior month.
- ISM Manufacturing (June) may have climbed to 49.1 from 48.7.
- Later this week we will get JOLTS Job Openings, final PMI readings, Factory Orders, FOMC Minutes, and monthly employment figures. Check out the attached economic calendar for times and details.
- Follow us on Instagram to see my daily Malek Market Minute videos and lots more: https://www.instagram.com/siebertfinancial/
.png)

