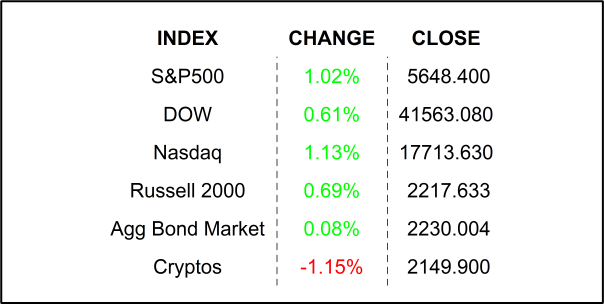
Stocks traded higher on Friday with a last-minute surge sealing the deal as traders rebalanced portfolios on the final trading day of the month. Core PCE inflation pulled back further than expected, further clearing the path for rate cuts later this month.
Enter the dragon. I remember the first time that someone asked me where the market was going tomorrow and I answered, simply “I don’t know.” Seeing the panic creep into their face, I quickly added, “…nobody knows.” That still didn’t help and realizing that I had just gotten my foot stuck deeply in the mud, I had to step back and give a quick lecture on the Efficient Market Hypothesis. I have covered it in detail many times in my past notes, so, for today, at least I will give you the shorter version of the short version. The Efficient Market Hypothesis states (in many more words) that all available information (even insider information) is already baked into a stock’s price, it is therefore impossible to consistently earn extra-market returns without adding more risk. Many people refer to the market’s behavior as a random walk. So, what’s the point, then?
HOLD ON, now. There is a post-script to this story. There have been over 400 documented anomalies to the Efficient Market Hypothesis! That means, folks have discovered predictable patterns which can, in fact, be exploited to beat the market. Do you feel better now? These anomalies fall into a variety of categories. Some examples are Value/Size anomalies, momentum effects, post-earnings drift, reversal effect, and calendar effects. If you stick around long enough with me, I have and will continue to cover most of these in more detail, but today I want to focus on calendar effects, and you will know why if by the time we get to the bottom of the page.
A calendar effect is a market anomaly where stock returns show patterns or trends based on the time of the year, such as certain days, months, or seasons. A very popular one is The January Effect which observes that stocks tend to rise in January. You may not have known that by name, but you are probably recalling that January is typically a good month for your portfolio. You may have also heard the term “sell in May and go away,” which is another example of a calendar effect. NOW, PLEASE CALM DOWN… do not rush over to your computer and start trading just yet. There is lots of fine print associated with these anomalies. The first and most important one is that they are based on historical observations. For example, if I told you that January is a good month for stocks, I am misleading you. I really should say “historically, stocks perform positively, ON AVERAGE., in January” That means that they don’t always perform well, and that there may be periods of time when it does not. Therefore, if you happen to try it in this upcoming January, you may lose money. The only accurate takeaway from my statement should be, if you HAD invested in the S&P500 in January of every year for the past 100 years, you would have made money. If you had missed a few years, or even dawdled for a day or two on the buy or the sell, the results could have been… less than desirable. Are you following me? Good.
Yes, there are anomalies, and yes, they are real, but there are caveats, lots of em’. Let’s take a quick step back and try and understand why these anomalies exist. If you read all the academic papers on these anomalies – I HAVE, so you don’t have to, you would learn that a common explanation for these effects is market psychology. In the case of the January Effect, it is likely that investors come back to the markets in January with renewed, positive feelings and load up their portfolios for the new year ahead, thus pushing stocks higher. There is also a more practical explanation. Many people sell stocks in December for tax-loss harvesting to offset capital gains. They then buy again in January which can push stocks higher. So, there are practical explanations for these anomalies.
“But, Mark, it’s September, why are you talking about January,” you are wondering. Because there is something known as the September Effect. I am sorry to have to tell you this, but September is typically the worst performing month for the S&P500 since 1950. A commonly cited reason is traders returning from summer vacations and adjusting portfolios. Another one is traders raising money to pay for school tuitions 🤔. I am sure that you can come up with a few yourself. Regardless, the anomaly has been observed, historically.
But there is one final thing I need to tell you about anomalies. If everyone knows about the anomaly, it is not likely that you can realize the arbitrage. If you knew that September was going to be a down month, it is likely that you would sell in August in order to get a jump on the hoards. If so, the market is already likely to have been affected, and the hoard-beaters are likely to cover shorts or start buying just as you start to sell. In other words… DON’T DO IT. But do make investment decisions based on what is happening with the economy on individual stocks. We have plenty to trade on based on those two factors alone. I have one last thing to leave you with. The Monday Effect, which describes how Monday is the worst performing day of the week… historically… on average. Welcome to the first Monday in September. Ok, wait, it’s not Monday, but it is the first trading day of the week, so will the effect hold? Have a nice day 😊.
FRIDAY’S MARKETS

NEXT UP
- ISM Manufacturing (August) may have climbed to 47.5 from 46.8. This will be closely watched as it is below 50.0 indicating a contraction for manufacturing.
- Later this week, we will get a few more earnings releases along with some real market movers such as JOLTS Job Openings, Factory Orders, and the monthly employment report. Download the attached calendars so you can be the early bird.
.png)

