MY HOT TAKES
-
The stock market has done more to save the economy than rate cuts
-
Monetary policy is still tight—don’t let last year’s cuts fool you
-
Experts don’t know for sure—but they might have better odds of getting it right
-
The AI rally may be the hidden hero of this cycle
-
Charts don’t lie—interpretation does
-
You can quote me: “Access to information is not the same as knowing what to do with it—and that’s the real difference between an expert and everyone else.”
Lead the way. If you watched any financial news station on TV or streamed it to your phone or computer, you would witness a steady stream of seasoned experts prognosticate on stocks, bonds, interest rates, the economy, and even baseball. Come to think of it, I am one of those folks. Being that I am one of those folks, I feel that I am in a good position to tell you a secret. Stay tuned. Those experts seem so confident. I think this, we think that, the economy is blah, blah, blah, our target for the index is x.xxxxxx! How do they… er, we know that stuff.
There used to be a time where experts in glass-covered, New York skyscrapers had access to more information than the average Joe or Joan, but with the advent of the internet, investors have access to a treasure trove of information at their fingertips, and most of it is free! If you have gumption you can collect quite a bit of critical information and be almost on par with the so-called experts. You can then use that information to decide where stocks or the economy is headed. Do you know where the economy is headed? Can you say it with the confidence of those TV experts? What if I told you that all that fuss is unnecessary and that you could simply consult an indicator that has been around since 1958!
It’s true! The Conference Board has been publishing its Index of Leading Indicators since the year Elvis was drafted in the Military and NASA was founded. You don’t have to know much about either of those references to know that it was a long time ago. The index, known as LEI, is supposed to give us a good indication of where the US economy is headed. It factors in weekly work hours, Initial Jobless Claims, new orders made by manufacturers (materials and capital goods), ISM New Orders Index, S&P 500 performance, credit index performance, the yield curve, and consumer sentiment.
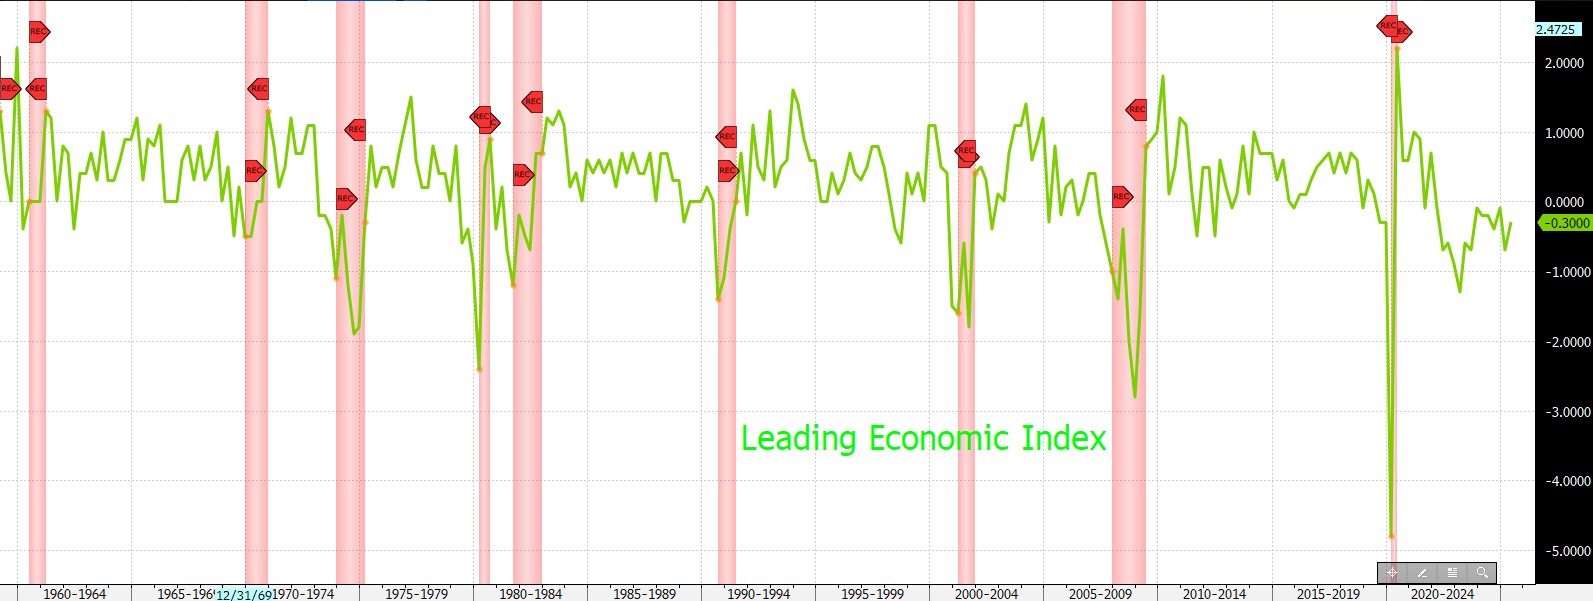
Reading through that list, it seems reasonable that those would give us a good snapshot of the state of the economy. As the word “leading” in its title, the index is supposed to tell us where the economy is headed. But does it? Why not have a look for yourself. Check it out.
On this chart, you can see that the LEI (green line) indeed does seem to decline noticeably prior to recessions (areas shaded in red). There is something peculiar about this chart, however. If you look all the way over to the right, you will notice that the index tanked in 2022 as the Fed began its massive monetary tightening campaign, and it has been under water almost exclusively since. But yet, unlike in the past, no recession has followed. In fact, if you look closely at the chart, you will notice that LEI made its largest monthly, post-pandemic decline this past April. If you are paying attention, you shouldn’t be surprised given the events of that month and how the index is constructed.
Yesterday, the Conference Board released its LEI for June and it came in as expected, down by -0.3% after being unchanged in May. Could this be a sign that things are about to get worse in the economy? Well, if we look at the index components, we see that there were negative attributions associated with consumer confidence, new orders, and weekly jobless claims. Keeping the index from coming in with a bigger decline was S&P 500 performance. Does any of this surprise you? It shouldn’t, if you have been paying attention. Still, is that enough to convince you that the economy is on the verge of collapse? If not, what does it tell us? Perhaps if I showed you a chart of the index broken down into its components, it would make it a bit clearer. Have a look at my favorite Bloomberg ECAN chart of LEI, then follow me to the finish.
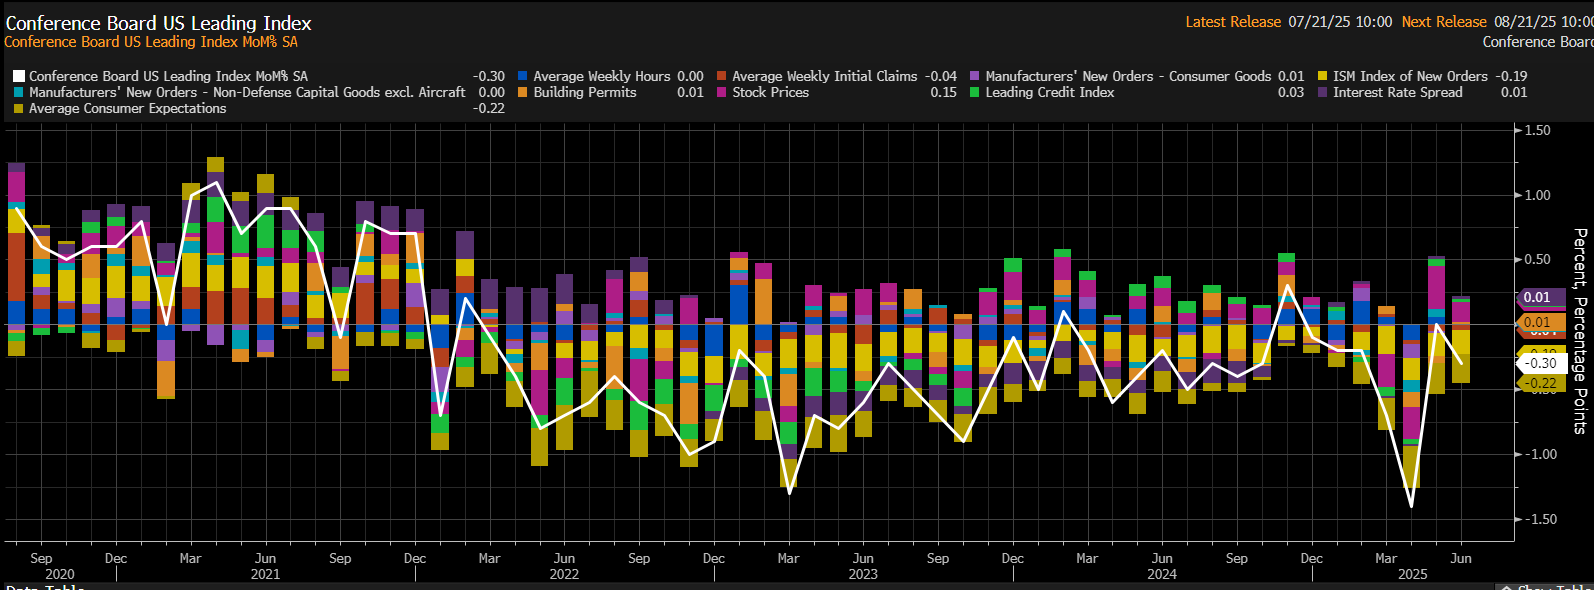
Isn’t this an amazing chart? The white line is the LEI and the stacked bars show the change in the components of the monthly index. First thing you should note is how the white line jumped into negative territory just as the Fed started to raise interest rates in 2022, and how it has clearly stayed negative for most of the time thereafter. If you really look closely at the bars below zero, it would make clear sense to you as those are directly affected by the Fed’s intentional pressing on the economic brakes. Interestingly, you will notice that there is a preponderance of pink bars above zero–positive attribution. That is stock market performance. Are you surprised? Of course, not.
So what can we glean from this information? How can a Leading index stay so negative for so long without a recession? Well, the answer should be clear: Fed policy! Fed policy went restrictive in 2022 and IT IS STILL RESTRICTIVE, despite last year’s rate cuts. How were we able to avoid a recession in these past few years? Well, if you believe that the LEI is a good indicator, the answer is: the stock market. The above-average performance of equities over the past few years (since 2022) has enabled the Fed to keep monetary policy tight and fight inflation while avoiding a nasty recession. What drove the stock markets in these past couple of years? Many things, but principally, the AI revolution. But can we avoid a recession forever given tight monetary policy and shifting trade policy? No one knows the answer to that question, but it would appear that the Fed has the ability to increase the chances of avoiding a recession.
Getting back to all that information available to investors today. It is true that you have access to almost all the same information as any of those smart folks on TV. However, information alone is not enough to forecast what comes next. It is what one does with that information, and those experts–hopefully–know what to do with the information. Here is the secret I promised. Those experts don’t know for certain about what comes next, but their expertise does enable them to increase the chances of being right. To my long-time, regular followers, thank you for continuing on this journey with me as I break it all down for you, not just here in this blog/newsletter and in my daily videos, but also as one of those, so-called, smart folks on TV. 😉 P.S. I post most of my TV appearance on LinkedIn; follow me to keep up:
www.linkedin.com/in/mark-malek-364228
YESTERDAY’S MARKETS
Stocks closed mixed and slightly higher as the S&P and Nasdaq notched new highs as investors waited patiently for the earnings fireworks display that is about to begin. 10-year yields clipped for a 4th straight session. The heat remains high on the Fed Chair who will speak this morning.
.png)